

Abstract
Cytokine treatment of NK cells results in alterations in multiple cellular responses that include cytotoxicity, cytokine production, proliferation, and chemotaxis. To understand the molecular mechanisms underlying these responses, microarray analysis was performed and the resulting gene expression patterns were compared between unstimulated, IL-2, IL-2 plus IL-12, and IL-2 plus IL-18-stimulated NK92 cells. RNase protection assays and RT-PCR confirmed microarray predictions for changes in mRNA expression for nine genes involved in cell cycle progression, signal transduction, transcriptional activation, and chemotaxis. Multiprobe RNase protection assay also detected changes in the expression of CCR2 mRNA, a gene that was not imprinted on the microarray. We subsequently expanded our search for other chemokine receptor genes absent from the microarray and found an IL-2- and IL-12-dependent decrease in CXCR3 receptor mRNA expression in NK92 cells. A detailed analysis of CXCR3 expression in primary NK cells revealed that an IL-2 and an IL-12 together significantly decreased the CXCR3 receptor mRNA and receptor surface expression by 6 and 24 h of treatment, respectively. This decrease in receptor expression was associated with a significant reduction in chemotaxis in the presence of IFN-γ-inducible protein-10. The decline in CXCR3 mRNA was due to transcriptional and posttranscriptional mechanisms as the addition of actinomycin D to IL-2- and IL-12-treated NK92 slightly altered the half-life of the CXCR3 mRNA. Collectively, these data suggest that IL-2 and IL-12 directly affect NK cell migratory ability by rapid and direct down-regulation of chemokine receptor mRNA expression.
Natural killer (NK) cells are large granular lymphocytes that play an important role in the defense against virally infected or malignant cells (1). Their activity can be characterized as nonadaptive and independent of MHC restriction (1, 2). A variety of NK cell functions including cytotoxicity, proliferation, chemotaxis, and cytokine production are modulated by regulatory cytokines including IFN-αβ, IL-2, IL-12, IL-18, IL-10, and TNF (reviewed in Refs. 3 and 4). Because cytokines induce such a broad range of effects in NK cells, the potential for alterations in gene expression in stimulated cells is very great. To determine which genes are regulated in response to cytokine stimulation, our laboratory has used cDNA microarray technology to examine gene expression in NK cells. Microarray technology is very useful because it allows for large-scale examination of gene expression. Additionally, this technology has proved useful in identifying physiologically relevant gene expression patterns in eukaryotic systems such as yeast (5) and fibroblasts (6) as well as predicting patterns of gene expression in tumor cells (7, 8). To examine gene expression in response to cytokine stimulation, a human NK cell line, NK92, was stimulated with IL-2 alone or in combination with IL-12 or IL-18. These cytokines were chosen because of their ability to induce NK cell responses; however, little is known about the repertoire of genes that are activated by these cytokines. Microarray analysis of gene expression in NK92 cells identified a variety of genes whose mRNA expression patterns change in response to cytokine stimulation. The genes encoding the mRNAs are not specific to any one pathway; however, changes in cytokine, chemokine, and chemokine receptor gene mRNAs were prevalent. Our mRNA studies on chemokine receptor gene expression were extended to cell surface analysis of receptor densities in cytokine-treated primary NK cells. Using FACS analysis, we observed a significant decrease in CXCR3 receptor expression in NK cells treated for 24 h with IL-2 and IL-12 alone or in combination. Recently, alterations in chemokine receptor expression were reported in IL-2-stimulated NK cells (9); however, the cells were cultured in IL-2 for 8–10 days. In contrast, our data demonstrate that cytokines can modify chemokine receptor function within hours, thus supporting a model whereby cytokines, in particular IL-2 and IL-12, regulate chemokine receptor expression in a direct, rapid, and novel manner.
Materials and Methods
NK cell preparation
PBMC were isolated from buffy coats of healthy donors (obtained from the National Institutes of Health Blood Bank, Bethesda, MD) after centrifugation on a lymphocyte separation medium. Cells were washed twice with Dulbecco’s PBS and suspended in RPMI 1640 medium supplemented with 2 mM l-glutamine, 100 IU/ml penicillin, 50 μg/ml streptomycin, and 10% FCS. Adherent cells were removed by incubation in plastic flasks for 1 h at 37°C. Nonadherent cells were recovered by gently washing with warmed medium and were further purified by incubating on nylon wool columns for 1 h at 37°C. The nylon-nonadherent cells (mostly T cells and NK cells) were eluted with prewarmed RPMI-640 medium and fractionated on a seven-step Percoll gradient as previously described (10). The NK cell-enriched low-density fraction-2 (40–60% NK cells) was further depleted of remaining T lymphocytes and monocytes by negative selection with anti-CD3 and anti-CD14 mAbs. Briefly, the cells were labeled for 30 min on ice with biotinylated anti-CD3 and anti-CD14 Abs. After removing the unbound Abs by washing with cold PBS plus 1% BSA, the cells were incubated 15 min with streptavidin microbeads (Miltenyi Biotec, Oslo, Norway) and the positive cells (CD3+ and CD14+) were removed with a magnetic column (MACS; Miltenyi Biotec). Purified NK cell populations were >95% CD56+/CD5− cells as determined by two-color flow cytometry analysis (FACSort; BD Biosciences, San Jose, CA) with anti-CD56 PE and anti-CD5 FITC (BD Biosciences).
Cell culture
NK92 cells were maintained in RPMI 1640 medium (BioWhittaker, Walkersville, MD), supplemented with 10% FCS, 2 mM l-glutamine, 100 U/ml penicillin, 100 μg/ml streptomycin, 200 U/ml recombinant human IL-2, and 10 ng/ml recombinant human IL-15. Cells were cultured at a density of 5 × 10⁵/ml in a 37°C incubator with 5% CO2. For all experiments, cells were grown at a density of 1 × 10⁶/ml in medium lacking IL-2 and IL-15 for 12 h before cytokine stimulation.
Freshly isolated primary NK cells were placed into warm RPMI 1640 medium, supplemented with 10% FCS, 2 mM l-glutamine, 100 U/ml penicillin, and 100 μg/ml streptomycin and immediately treated with 100 U/ml IL-2, 10 U/ml IL-12, or 10 ng/ml IL-18, alone or in combination.
Poly(A)+ RNA preparation, microarrays, and data analysis
Approximately 100 × 106 NK92 cells were stimulated for 3 h with 100 U/ml IL-2 alone or in combination with 10 U/ml IL-12 or 10 ng/ml IL-18. Poly(A)+ RNA was isolated according to the manufacturer’s protocol using a FastTrack 2.0 mRNA isolation kit (Invitrogen, Carlsbad, CA). Incyte Genomics (St. Louis, MO) performed the cDNA generation, hybridization, and data collection. Alterations in gene expression were evaluated by reverse transcription of poly(A)+ RNAs in the presence of Cy3 or Cy5 fluorescent labeling dyes followed by hybridization to UniGEM human V microarray chips (Incyte Genomics). Each chip contains a total of 7075 elements of which 6794 are unique genes/clusters. These unique genes/clusters can be further defined as 4610 annotated and 2184 unannotated sequences. Subsets of genes were selected based on differential Cy3/Cy5 expression ratios that were ≥|2| in response to any treatment. Differential expression of representative selected genes was confirmed by RT-PCR and/or RNase protection assay (RPA).3
RNA isolation, relative quantitative RT-PCR, RPA
To confirm microarray predictions, ∼10 × 106 NK92 cells were rested overnight without IL-2 and IL-15. The cells were either nonstimulated or stimulated with IL-2 (100 U/ml), IL-12 (10 U/ml), and IL-18 (10 ng/ml) alone or in combination for 3 h. Total RNA was isolated from the untreated and cytokine-treated cells using the TRIzol (Life Technologies, Bethesda, MD) extraction procedure. For relative quantitative RT-PCR, ∼5 μg of RNA was reverse transcribed using a Thermoscript RT-PCR system (Life Technologies). The cDNA template was generated according to the manufacturer’s protocol with random hexamers as primers for initiation of reverse transcription. Multiplex PCR was performed using Platinum PCR Supermix (Life Technologies) and primers specific for the human 18S rRNA gene and also the gene of interest. The amplification efficiency of the 18S rRNA gene was modulated using an 18S Competitimer technology (Ambion, Austin, TX). This allowed the 18S gene to be expressed in the same linear range as the gene of interest when amplified. The amount of PCR product for the gene of interest could then be compared with the amount of 18S product to estimate the amount of variation between samples.
The multiprobe RPAs were performed according to the manufacturer’s directions (BD PharMingen, San Diego, CA) with the following modifications: RNase inactivation and precipitation was performed using a master mixture containing 200 μl Ambion RNase inactivation reagent, 50 μl ethanol, 5 μg yeast tRNA, and 1 μl Ambion GycoBlue coprecipitate per RNA sample. After adding the individual RNase-treated samples to 250 μl of the inactivation/precipitation mixture, the samples were mixed well, placed at −70°C for 30 min, and subjected to centrifugation at 14,000 rpm for 15 min in a room temperature microcentrifuge. The supernatants were decanted, a sterile cotton swap was used to remove excess liquid, and the pellet was resuspended in 3 μl of BD PharMingen sample buffer. Each multiprobe RNase assay included probes specific for ribosomal L32 and GAPDH mRNAs to assure equal amounts of input mRNA in each assay and to control for lane to lane variation during PAGE.
For guanylate binding protein 1 (GBP-1)-1 and Src homology 2 domain-containing leukocyte protein of 76 kD (SLP-76) mRNA analysis, RPA probes were synthesized from plasmid DNA templates using T7 RNA polymerase and [α-33P]UTP in an in vitro transcription reaction. The newly synthesized riboprobes were loaded onto a 6% denaturing polyacrylamide gel and full-length probes were excised and eluted from the gel by overnight incubation at 37°C in gel elution buffer (supplied in RPA II kit; Ambion). For each RPA, ∼100 × 104 cpm and 50 × 104 cpm of the gene-specific and 18S rRNA probes were used, respectively. RPAs for GBP-1 and SLP-76 were performed according to the manufacturer’s protocol using a RPA II RNase protection assay kit (Ambion) with 10 μg of input RNA per reaction. For all multiprobe and single-probe RPAs, protected RNA products were separated by size on a 6% denaturing polyacrylamide gel. Gels were dried under vacuum at 80°C for ∼2 h and exposed to either x-ray film or a PhosphorImager screen for 16 to 24 h. Film images were scanned and signal intensities were quantitated using TotalLab image analysis software (Phoretix, Newcastle Upon Tyne, U.K.). Phosphorimages were generated and quantitated using PhosphorImager SI analysis and ImageQuant software (Molecular Dynamics, Sunnyvale, CA).
mRNA half-life measurement
Rested NK92 cells were treated with IL-2 (100 U/ml) and IL-12 (10 U/ml) alone or in combination in the presence of actinomycin D (5 μg/ml). Total RNA was isolated at multiple times and CXCR3 mRNA expression was measured by multiprobe RPA using [α-33P]UTP-labeled riboprobes transcribed from a hCR-6 template (BD PharMingen). The protected mRNA fragments were size separated on a 6% polyacrylamide gel under denaturing conditions. The RPA gels were dried and exposed to a PhosphorImager screen for 12–24 h. Images were visualized and quantitated using PhosphorImager SI analysis and ImageQuant software (Molecular Dynamics).
Flow cytometry analysis
To examine CXCR expression, primary NK cells were stained with FITC-conjugated CXCR3 or CXCR4 mAbs (R&D Systems, Minneapolis, MN) and PE-conjugated CD56 mAb (BD Biosciences). For CCR expression, NK cells were stained with PE-labeled CCR1 or CCR2 mAbs (R&D Systems) and FITC-conjugated CD16 mAb (BD Biosciences). Cells were also stained using isotype controls FITC-conjugated IgG1 and PE-conjugated IgG2A Abs (BD Biosciences). All cells were analyzed using a FACSort flow cytometer (BD Biosciences).
Chemotaxis assay
NK cell migration was assessed with 48-well microchemotaxis chambers (NeuroProbe, Cabin John, MD). The chemoattractants were placed in the wells of the lower compartment. The cells (at 3 × 10⁶/ml) were placed in the wells of the upper compartment. A 5-μm pore-sized polycarbonate filter precoated with fibronectin separated the two compartments. After incubation at 37°C for 3 h, the filter was removed, stained with DiffQuik, and the cells migrated across the filter were counted under microscopy with the samples coded. The cell migration was tested in triplicates and the chemotaxis index represents the fold-increase of cell migration in response to chemokines over medium control. The statistical significance was examined with the Student t test.
Results
Cytokine-induced alterations in gene expression
Microarray experiments were performed to examine changes in gene expression patterns in NK cells in response to cytokine activation. In one experiment, changes in mRNA expression in resting cells were compared with those observed in IL-2-activated NK cells. In a second experiment, gene expression patterns were compared in NK cells under two different stimulatory conditions. For this, mRNA from IL-2 plus IL-12-stimulated cells was compared with mRNA from IL-2 plus IL-18-stimulated cells. In all experiments, cells were stimulated for 3 h and poly(A)+ mRNA was isolated and evaluated by microarray analysis.
Stimulation of NK cells by IL-2 resulted in identification of a total of 65 genes with greater than 2-fold changes in expression (Table I). Of these, the majority of the genes (n = 49) were up-regulated by IL-2. The identified genes were involved in a variety of cellular processes that included transcriptional activation, intermediary metabolism, signal transduction, and cell cycle regulation. Microarray analysis of mRNA from IL-2 plus IL-12 and IL-2 plus IL-18-stimulated NK92 cells did not reveal a large of amount of differential regulation. Of the 17 genes identified, most (n = 10) were up-regulated by IL-2 plus IL-12 as compared with IL-2 plus IL-18 (Table II). We were surprised at the overall lack of differential gene expression between cells treated with IL-12 and IL-18. Many cytokines bind receptors that have common subunit chains that are shared with other receptors. The commonality between receptors may attribute to the activation of similar signaling pathways by different cytokines. IL-12 and IL-18 receptors, however, are structurally very different and do not share common receptor chains. Thus, their cellular target genes would potentially be very different; however, the converse is true. These data suggest that IL-12 and IL-18 signaling pathways converge at the nuclear level to activate similar subsets of genes.
Analysis of gene expression in nonstimulated and IL-2–stimulated NK92 cells
| Gene Name | GenBank Accession Number | Nonstimulated Signal | IL-2–Stimulated Signal | Fold Change |
|---|---|---|---|---|
| Genes down–regulated by IL-2 | ||||
| EST | AI380052 | 17,963 | 6,861 | −2.62 |
| AHNAK nucleoprotein (desmoyokin) | M80899 | 5,022 | 2,085 | −2.41 |
| Homo sapiens nuclear Ag H731-like protein | U96628 | 4,810 | 2,287 | −2.1 |
| IL-9R | M84747 | 3,902 | 1,415 | −2.76 |
| V-yes-1 Yamaguchi sarcoma viral–related oncogene homolog | M16038 | 2,562 | 1,233 | −2.08 |
| IL-16 (lymphocyte chemoattractant factor) | AI652705 | 2,540 | 1,235 | −2.06 |
| DB1 | AA195154 | 2,492 | 1,050 | −2.37 |
| Conserved gene amplified in osteosarcoma | AF022231 | 2,162 | 1,043 | −2.07 |
| 5′ fragment, not mapped (Incyte PD: 194162) | N/Aa | 1,668 | 713 | −2.34 |
| PI3K, regulatory subunit, polypeptide 1 (p85 α) | M61906 | 1,275 | 398 | −3.2 |
| Fucosidase, α-L-1 | M80815 | 1,122 | 318 | −3.53 |
| Human EV12 protein gene | M55267 | 800 | 394 | −2.03 |
| EST, highly similar to HMG box containing protein 1 | H86395 | 729 | 364 | −2 |
| B cell translocation gene 1, anti-proliferative | AI925293 | 654 | 234 | −2.79 |
| EST | AI436055 | 370 | 159 | −2.33 |
| Sortilin-related receptor, L(DLR class) | Y08110 | 265 | 126 | −2.1 |
| Genes up-regulated by IL-2 | ||||
| Chemokine (C-C motif) receptor 1 | D10925 | 4,456 | 22,840 | 5.13 |
| EST, moderately similar to heat shock protein HSP 90-β | AL040289 | 7,070 | 15,715 | 2.22 |
| Human pim-2 protooncogene homolog pim-2h | AI634033 | 4,062 | 13,916 | 3.43 |
| V-myc avian myelocytomatosis viral oncogene homolog | V00568 | 4,229 | 13,642 | 3.23 |
| Human serine protease gene | J02907 | 5,694 | 12,758 | 2.24 |
| Lactate dehydrogenase B | AL044172 | 4,993 | 12,238 | 2.45 |
| Solute carrier family 7 (cationic amino acid transporter, y+ system), member 7 | AJ130718 | 2,242 | 11,686 | 5.21 |
| Differentiated embryo chondrocyte expressed gene 1 | AB004066 | 3,309 | 9,317 | 2.82 |
| Lymphocyte cytosolic protein 2 | U20158 | 4,184 | 9,299 | 2.22 |
| IL-10 | M57627 | 3,373 | 7,861 | 2.33 |
| Pim-1 oncogene | M54915 | 1,533 | 7,829 | 5.11 |
| GBP 1, interferon-inducible | M55542 | 3,229 | 7,274 | 2.25 |
| Cyclin D2 | D13639 | 1,918 | 6,180 | 3.22 |
| CSF 1 (macrophage) | M11296 | 2,691 | 5,753 | 2.14 |
| Perforin 1 (preforming protein) | AI076019 | 2,618 | 5,736 | 2.19 |
| Tryptophanyl-tRNA synthetase | X59892 | 2,247 | 5,730 | 2.55 |
| Ornithine decarboxylase 1 | M16650 | 1,806 | 5,380 | 2.98 |
| Putative translation initiation factor (Incyte PD: 58399) | N/A | 2,478 | 5,344 | 2.16 |
| MX1 (influenza), homolog of murine (IFN-inducible protein p78) | M30817 | 1,645 | 5,275 | 3.21 |
| IFN regulatory factor 1 | X14454 | 2,385 | 5,254 | 2.2 |
| FLN29 gene product | AB007447 | 1,854 | 5,040 | 2.72 |
| Dyskeratosis congenita 1, dyskerin | U59151 | 2,068 | 4,873 | 2.36 |
| Solute carrier family 1 (neutral amino acid transporter), member 5 | U53347 | 2,031 | 4,818 | 2.37 |
| 5′ not mapped fragment (Incyte PD: 2498667) | N/A | 1,456 | 4,625 | 3.18 |
| EST | AI127628 | 1,839 | 4,381 | 2.38 |
| Dual specificity phosphatase 5 | U15932 | 1,735 | 4,286 | 2.47 |
| Paired basic amino acid cleaving enzyme (furin, membrane associated receptor protein) | X17094 | 1,450 | 3,341 | 2.3 |
| EST | AI188513 | 1,165 | 3,335 | 2.86 |
| EST | AA559093 | 695 | 3,260 | 4.69 |
| Nucleolar phosphoprotein p130 | Z34289 | 1,116 | 2,929 | 2.62 |
| Human ras-like protein | AA459547 | 1,109 | 2,914 | 2.63 |
| Pleckstrin homology, Sec7 and coiled/coil domains, binding protein | AI538459 | 745 | 2,546 | 3.42 |
| Topoisomerase (DNA) I | U07806 | 911 | 2,138 | 2.35 |
| Flotillin 1 | AA618098 | 850 | 1,915 | 2.25 |
| Protein tyrosine phosphatase type IVA, member 1 | U48296 | 912 | 1,904 | 2.09 |
| Carcinoembryonic Ag gene family member 6 | X52378 | 654 | 1,847 | 2.82 |
| B cell CLL/lymphoma 2 | M14745 | 789 | 1,691 | 2.14 |
| Serine/threonine kinase 17b (apoptosis-inducing) | AA725600 | 783 | 1,580 | 2.02 |
| Bystin-like | L36720 | 665 | 1,437 | 2.16 |
| H. sapiens mRNA expressed in osteoblast | F12860 | 459 | 1,393 | 3.03 |
| Pregnancy specific β-1-glycoprotein 7 (Incyte PD: 64457) | N/A | 551 | 1,389 | 2.52 |
| Methionine adenosyltransferase II, α | F07456 | 592 | 1,342 | 2.27 |
| Glutamyl aminopeptidase (aminopeptidase A) | L12468 | 535 | 1,231 | 2.3 |
| Cytochrome P450, 51 (lanosterol 14-α-demethylase) | U23942 | 601 | 1,227 | 2.04 |
| Low density lipoprotein receptor (familial hypercholesterolemia) | L00352 | 559 | 1,121 | 2.01 |
| Fatty-acid-coenzyme A ligase, very long-chain 1 | D88308 | 460 | 1,012 | 2.2 |
| H. sapiens DKFZp564L176 (from clone DKFZp564L176) | D64110 | 353 | 862 | 2.44 |
| Regulator of G-protein signaling 16 | U70426 | 327 | 778 | 2.38 |
| IL 6 signal transducer (gp 130, oncostatin M receptor) | M57230 | 348 | 709 | 2.04 |
N/A represents genes that do not have GenBank accession numbers. The Incyte PD identification numbers are provided. Expression of genes listed in italics was evaluated by RPA or semi-quantitative RT-PCR analysis.
Analysis of gene expression in IL-2 + IL-12 and IL-2 + IL-18–treated NK92 cells
| Gene Name | GenBank Accession Number | IL-2 + IL-12–Stimulated Signal | IL-2 + IL-18–Stimulated Signal | Fold Change |
|---|---|---|---|---|
| Genes down–regulated by IL-2+ IL-18 as compared to IL-2+ IL-12 | ||||
| Ornithine decarboxylase 1 | M16650 | 2,372 | 1,134 | −2.09 |
| Peptidylprolyl isomerase E (cyclophilin E) | AF042386 | 810 | 320 | −2.53 |
| GTP-binding protein overexpressed in skeletal muscle | U10550 | 719 | 134 | −5.37 |
| PGER2 (subtype EP2) | U19487 | 477 | 225 | −2.12 |
| EST highly similar to DNAJ protein homolog MTJ1 (M. musculus) | AI337322 | 236 | 115 | −2.05 |
| EST | AI890347 | 145 | 68 | −2.13 |
| Hyaluronan-mediated motility receptor (RHAMM) | U29343 | 128 | 58 | −2.21 |
| EST | R55801 | 122 | 55 | −2.22 |
| EST | AA868888 | 113 | 37 | −3.05 |
| V-maf musculoaponeurotic fibrosarcoma (avian) oncogene family, protein G | AF059195 | 108 | 46 | −2.35 |
| Genes up-regulated by IL-2+ IL-18 as compared to IL-2+ IL-12 | ||||
| Apoptosis inhibitor 2 | U37546 | 724 | 2,466 | 3.41 |
| NF of κ light polypeptide gene enhancer in B cell inhibitor, α | M69043 | 546 | 1,752 | 3.21 |
| Discoidin domain receptor family, member 1 | Z29093 | 663 | 1,334 | 2.01 |
| Carboxypeptidase D | D85390 | 427 | 1,007 | 2.36 |
| Regulator of G-protein signaling 16 | U70426 | 327 | 674 | 2.06 |
| Hypoxia-inducible factor 1, α subunit (basic helix-loop-helix transcription factor) | U22431 | 239 | 536 | 2.24 |
| Apoptosis inhibitor 1 | U37547 | 181 | 477 | 2.64 |
Predicted activation of genes confirmed by relative quantitative RT-PCR and RPA
Genes were selected from the microarray results for further analysis based on their predicted expression change or their potential to affect NK cell biology. These genes were directly tested for changes in mRNA expression by RPA or relative quantitative RT-PCR. Multiprobe and single-probe RPA were performed on RNA isolated from unstimulated NK92 cells as well as cells treated with IL-2 alone or in combination with IL-12 or IL-18. Predicted changes in gene expression in three primary families of genes were confirmed by multiprobe RPA. These families represent genes that code for cytokine, chemokine, and chemokine receptors.
To ensure that our cytokine treatments properly induced known cellular functions, an IFN-γ-specific probe was used as a positive control in RPA and RT-PCR analyses. Changes in IFN-γ mRNA expression are directly linked to cytokine stimulation (11, 12, 13) and thus, are useful measurements of cytokine-induced changes in gene expression. Consistent with previous reports (11, 14, 15), the RPA result demonstrated cytokine-induced increases in IFN-γ mRNA by IL-2 alone (Fig. 1). Moreover, the expected synergy between IL-2 and IL-12 or IL-18 on IFN-γ mRNA expression was observed. These data demonstrated that NK92 cells responded to cytokine treatment in an expected manner thus providing assurance that the microarray results accurately predicted changes in mRNA expression of other genes.

Multiprobe RNase protection analysis of gene expression in NK92 cells. NK92 cells were rested overnight in RPMI medium without IL-2 and IL-15. Cells were either untreated (NS) or stimulated with IL-2 (100 U/ml) alone or in combination with IL-12 (10 U/ml) and IL-18 (10 ng/ml) for 3 h. Total RNA was isolated as described in Materials and Methods and ∼10 μg of input RNA was used per hybridization. All RPAs were performed by hybridizing RNA to hCK1, hCK5, hCR5, hCR6, or hAPO5 multiprobe templates (BD PharMingen). The exposure time to film varied for individual RPAs and depended on the strength of the signal of the target genes. Differences in exposure are reflected by differences in GAPDH signal intensities. The data are representative of two independent experiments.
Multiprobe RNase protection analysis of gene expression in NK92 cells. NK92 cells were rested overnight in RPMI medium without IL-2 and IL-15. Cells were either untreated (NS) or stimulated with IL-2 (100 U/ml) alone or in combination with IL-12 (10 U/ml) and IL-18 (10 ng/ml) for 3 h. Total RNA was isolated as described in Materials and Methods and ∼10 μg of input RNA was used per hybridization. All RPAs were performed by hybridizing RNA to hCK1, hCK5, hCR5, hCR6, or hAPO5 multiprobe templates (BD PharMingen). The exposure time to film varied for individual RPAs and depended on the strength of the signal of the target genes. Differences in exposure are reflected by differences in GAPDH signal intensities. The data are representative of two independent experiments.
For examining changes in IFN-γ mRNA, we used a multiprobe template (hCK1) which also contains an IL-10-specific probe. This was useful because our microarray results predicted a greater than 2-fold increase in IL-10 mRNA in response to IL-2. Consistent with previous reports (16, 17, 18), RPA analysis demonstrated that IL-10 gene expression was altered by cytokine stimulation of NK cells (Fig. 1). Interestingly, the patterns of IL-10 and IFN-γ mRNA expression were parallel with respect to IL-2 alone and in combination with IL-12 or IL-18. We do not know why these two antagonistic cytokines are coexpressed in a similar fashion in NK cells; however, it is possible that the IL-10 may act as a negative regulator to shutdown IFN-γ expression. This is supported by a report that demonstrates that IL-10 secretion from Th2 cells acts to inhibit IFN-γ production in both Th1 cells and NK cells (19).
We next used RPA analysis to examine chemokine receptor mRNA expression in NK92 cells. Using a CCR-specific multiprobe RPA, we confirmed the microarray prediction for up-regulation of the chemokine receptor CCR1 by IL-2 (Fig. 1). Additionally, RPA analysis demonstrated a slight up-regulation of CCR2 mRNA expression by IL-2 plus IL-12. This gene was not imprinted on the microarray and was examined only as a result of our usage of the multiprobe RPA. As a result of this observation, we extended our study to other chemokine receptor genes that were absent on the microarray. Using a CXCR-specific RPA template, we found that CXCR3 mRNA expression was down-regulated 13% by IL-2. The combination of IL-2 with IL-12 or IL-18 further enhanced this effect with decreases of 38 and 56%, respectively (Fig. 1). In contrast, CXCR4 mRNA expression was up-regulated ∼1.2-fold by all cytokine treatments (Fig. 1), suggesting that effects on this gene were IL-2-specific.
Although our microarray data did not contain information pertaining to chemokines, changes in cytokine and chemokine receptor mRNA expression lead us to examine changes in these important chemotactic-inducing proteins. Consistent with a previous report (20), multiprobe RPA analysis demonstrated an IL-2 induction of macrophage-inflammatory protein (MIP)-1α mRNA. The inability of IL-12 to further enhance the MIP-1α mRNA expression indicated that IL-2 was the primary inducer of this mRNA. This was further supported by only a slight enhancement in MIP-1α mRNA expression in IL-2 plus IL-18-treated NK92 cells. In contrast to MIP-1α, MIP-1β mRNA expression was not affected by IL-2. However, IL-18 in combination with IL-2 did up-regulate expression of this chemokine.
We next examined mRNA expression of GBP-1 and myxovirus resistance 1 (MX1) genes. Both the GBP-1 and MX1 genes code for IFN-inducible GTP-binding proteins that protect cells against viral infection (21, 22, 23). Because NK cells are primary defenders against viral invaders, we speculated that these proteins might provide antiviral protection to NK cells during virus encounters. Our microarray results suggested that IL-2 should specifically up-regulate mRNA expression of both the GBP-1 and MX1 genes. RPA probes were designed and used for RPA analysis of these mRNAs. Consistent with the microarray results, we found that IL-2 up-regulated expression of the GBP-1 mRNA in NK92 cells (Fig. 2). This expression was specific to IL-2 in that costimulation with IL-12 or IL-18 had little or no effect on GBP-1 mRNA expression. Unlike GBP-1, MX1 mRNA expression did not correlate with the microarray results. RPA analysis revealed that NK92 cells did express MX1 mRNA; however, the expression was constitutive and cytokine-independent (Fig. 2). The lack of inducibility of the MX1 gene demonstrates that microarray results, like those from any single method, can be incorrect, thus necessitating independent conformation of gene expression changes by alternative methods.
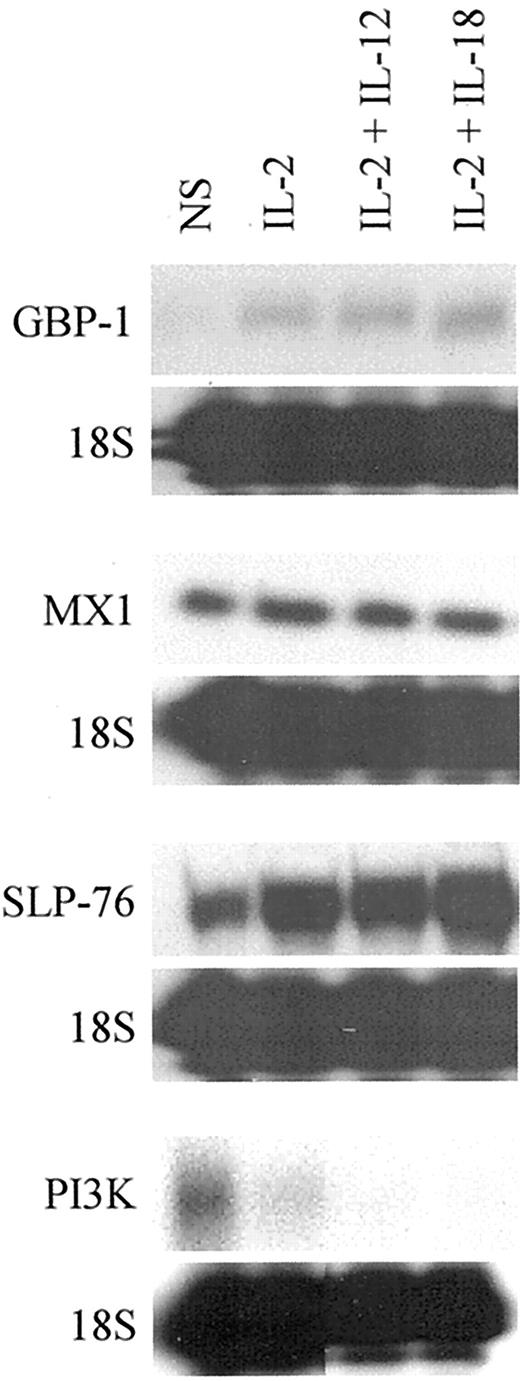
Single-probe RPA analysis of mRNA expression in NK cells. All probes were in vitro synthesized from gene specific sequences and gel purified before hybridization. The RPAs were performed according to manufacturer specifications using a RPA II kit (Ambion). The gels were exposed to film for a minimum of 24 h; however, exposure times varied for individual RPAs and depended on the strength of the signal of the target genes. The data are representative of two independent experiments.
Single-probe RPA analysis of mRNA expression in NK cells. All probes were in vitro synthesized from gene specific sequences and gel purified before hybridization. The RPAs were performed according to manufacturer specifications using a RPA II kit (Ambion). The gels were exposed to film for a minimum of 24 h; however, exposure times varied for individual RPAs and depended on the strength of the signal of the target genes. The data are representative of two independent experiments.
The microarray results also predicted that cytokine treatments of NK cells could alter mRNA expression of genes that code for signal transduction proteins. Two such genes were the p85 subunit of phoshoinositide-3-kinase (PI3K) and the lymphocyte cytosolic protein 2/SLP-76. RPA analysis of PI3K mRNA expression demonstrated an IL-2-dependent decrease in PI3K mRNA (Fig. 3). The IL-2 effect was enhanced by costimulation with IL-12 and IL-18, thus implicating these cytokines as coregulators of PI3K mRNA expression. In contrast, SLP-76 mRNA expression was significantly increased by IL-2 (Fig. 2). IL-2 appeared to be the primary regulator of SLP-76 mRNA in that no increase in mRNA expression was observed in the IL-2 plus IL-12-treated NK cells. Additionally, costimulation by IL-2 and IL-18 only slightly up-regulated the SLP-76 mRNA expression over that observed with IL-2 alone.

Relative-quantitative RT-PCR analysis of alterations in gene expression in NK92 cells. Approximately 5 μg of RNA was reverse transcribed using a Thermoscript RT-PCR system (Life Technologies). The resulting cDNA template was used for multiplex PCR with gene-specific and human 18S rRNA gene primers. The final PCR products were size-separated by agarose gel electrophoresis and visualized using ethidium bromide staining. The microarray values for the NS and IL-2-treated samples are listed to the left of each gene tested. No values are given for the IFN-γ gene as it was not represented on the microarray chip. However, relative-quantitative RT-PCR analysis was performed on the IFN-γ gene as a positive control for cytokine-induced changes in gene expression.
Relative-quantitative RT-PCR analysis of alterations in gene expression in NK92 cells. Approximately 5 μg of RNA was reverse transcribed using a Thermoscript RT-PCR system (Life Technologies). The resulting cDNA template was used for multiplex PCR with gene-specific and human 18S rRNA gene primers. The final PCR products were size-separated by agarose gel electrophoresis and visualized using ethidium bromide staining. The microarray values for the NS and IL-2-treated samples are listed to the left of each gene tested. No values are given for the IFN-γ gene as it was not represented on the microarray chip. However, relative-quantitative RT-PCR analysis was performed on the IFN-γ gene as a positive control for cytokine-induced changes in gene expression.
Relative-quantitative RT-PCR corroborated the predicted changes in the expression of five genes in response to IL-2 (Fig. 3). Of these, pim-1, cyclin D2, and c-myc genes code for proteins that are involved in cell cycle progression. Additionally, pim-1 and c-myc have been reported to act synergistically to prevent apoptosis (24) and thus may play a novel role in protecting NK cells from stress-induced cellular death.
The NK92 cell line is a good model for studying changes in cytokine gene expression; however, it is cytokine-dependent and may not entirely reflect changes in primary NK cells. To address this concern, we compared alterations in cell cycle gene expression in primary and NK92 cells. Overnight depletion of IL-2 from NK92 cells might result in changes in cell cycle gene expression that could be dramatically different from primary NK cells that have not been IL-2-depleted in culture.
The results from RT-PCR and RPA analysis of RNA from NK92 and primary NK cells, respectively, demonstrated that both cell types had large increases in cyclin D2 mRNA expression after 3 h of stimulation by all cytokines (Figs. 3 and 4 A). Interestingly, the primary NK cells exhibited a more robust response to IL-2 and IL-18 than did the NK92 cells. Moreover, cyclin D3 mRNA expression was slightly up-regulated in primary NK cells. This effect was not seen in NK92 cells (data not shown).

RPA and RT-PCR analysis of cell cycle-associated genes in primary human NK cells. Primary NK cells were stimulated with IL-2 (100 U/ml) alone or in combination with IL-12 (10 U/ml) or IL-18 (10 ng/ml) for 3 h. Total mRNA was isolated from the cells and mRNA expression was evaluated. A, mRNA expression of cyclins D2 and D3 were examined by RPA using a hCYC-1 multiprobe. GAPDH was included as a control for sample-to-sample variation. B, Relative-quantitative RT-PCR analysis c-myc and Pim-1 expression. 18S ribosomal RNA was used as an internal control in this assay. These results are representative of assays performed on RNA from two independent donors.
RPA and RT-PCR analysis of cell cycle-associated genes in primary human NK cells. Primary NK cells were stimulated with IL-2 (100 U/ml) alone or in combination with IL-12 (10 U/ml) or IL-18 (10 ng/ml) for 3 h. Total mRNA was isolated from the cells and mRNA expression was evaluated. A, mRNA expression of cyclins D2 and D3 were examined by RPA using a hCYC-1 multiprobe. GAPDH was included as a control for sample-to-sample variation. B, Relative-quantitative RT-PCR analysis c-myc and Pim-1 expression. 18S ribosomal RNA was used as an internal control in this assay. These results are representative of assays performed on RNA from two independent donors.
We continued our study of cell cycle-related genes by examining c-myc and pim-1 mRNA expression in primary NK cells. RT-PCR analysis revealed that all cytokine treatments could induce c-myc and pim-1 mRNA levels in primary NK cells (Fig. 4 B). These observations were in good agreement with RT-PCR results from NK92 cells. Collectively, these data indicate that regulation of NK92 cells is similar in many ways to primary NK cells with regard to IL-2, IL-2 plus IL-12, and IL-2 plus IL-18 treatments. Thus, NK92 cells appear to be a reliable model to predict global changes in gene expression in primary NK cells.
Cytokine-induced changes in chemokine receptor density on primary NK cells
RPA analysis demonstrated that IL-2 alone and in combination with IL-12 or IL-18 had a large impact on cytokine, chemokine, and chemokine receptor expression in NK92 cells. To determine whether these changes were functional in primary NK cells, we examined the potential for cytokine-induced alterations in chemokine receptor expression. Recent studies have demonstrated the presence of chemokine receptors on NK cells (9, 25, 26, 27); however, no studies have addressed alterations in these receptors in response to short-term activation by IL-2 alone and in combination with IL-12 or IL-18.
To examine changes in chemokine receptor density, freshly isolated NK cells that were greater than 95% CD56+/CD5− by FACS analysis, were placed into culture and stimulated with IL-2, IL-12, and IL-18 alone. Additionally, cells were stimulated with IL-2 in combination with IL-12 or IL-18. After 24 h of cytokine stimulation, alterations in CCR1, CCR2, CXCR3, and CXCR4 densities were evaluated by FACS analysis. Expression of CCR1 and CCR2 was virtually absent in all treatments (Table III). The lack of CCR1 expression was in direct contrast to CCR1 mRNA expression in NK92 cells. We considered the likelihood that there were differences in the expression of this receptor between the NK92 cell line and primary cells; however, it has been recently reported that primary NK cells express CCR1 mRNA although surface expression of the receptor is undetectable (9).
FACS analysis of cytokine-induced changes in surface chemokine receptor expression in primary NK cellsa
| Chemokine Receptor | NS | IL-2 | IL-12 | IL-18 | IL-2 + IL-12 | IL-2 + IL-18 |
|---|---|---|---|---|---|---|
| CCR1 | 0 | 0 | 0 | 0 | 0 | 0 |
| CCR2 | 0 | 0 | 0 | 0 | 0 | 0 |
| CXCR3 | 81 | 58 | 60 | 83 | 26 | 55 |
| CXCR4 | 25 | 28 | 26 | 27 | 26 | 29 |
| Chemokine Receptor | NS | IL-2 | IL-12 | IL-18 | IL-2 + IL-12 | IL-2 + IL-18 |
|---|---|---|---|---|---|---|
| CCR1 | 0 | 0 | 0 | 0 | 0 | 0 |
| CCR2 | 0 | 0 | 0 | 0 | 0 | 0 |
| CXCR3 | 81 | 58 | 60 | 83 | 26 | 55 |
| CXCR4 | 25 | 28 | 26 | 27 | 26 | 29 |
These data represent one of two separate experiments. For both experiments, freshly isolated NK cells were from individual donors.
Examination of CXCR3 surface expression revealed dramatic decreases in receptor density in response to cytokine treatment. In cells treated with IL-2 and IL-12 alone, there was a 28 and 26% reduction in CXCR3 expression, respectively (Table III and Fig. 5). The combination of these cytokines was synergistic with a 68% decrease in receptor density. IL-18 alone or in combination with IL-2 had no effect on CXCR3 expression. There was general agreement between CXCR3 expression in primary NK cells and mRNA expression in NK92 cells with regard to IL-2 and IL-12 regulation of this receptor. In contrast, RPA analysis of CXCR3 mRNA expression in NK92 cells predicted that the maximum decrease in receptor density should result from IL-2 plus IL-18 treatment. This prediction was not substantiated in primary NK cells and may reflect differences in the manner by which primary NK cells and NK92 respond to IL-2 plus IL-18 with respect to RNA and protein expression of CXCR3. Finally, we examined changes in CXCR4 receptor expression. Our RPA results suggested that there should be cytokine-independent expression of CXCR4 in NK cells. Flow cytometry analysis demonstrated that ∼25% of primary NK cells expressed CXCR4 (Table III). Moreover, receptor density remained unchanged with respect to cytokine stimulation.

Inhibition of CXCR3 expression by IL-2 and IL-12. Freshly isolated primary NK cells were stimulated with 100 U/ml IL-2, 10 U/ml IL-12, or 10 ng/ml IL-18, alone or in combination for 24 h and CXCR3 expression was compared with that observed in nontreated (NT) cells by flow cytometry analysis. A, Receptor expression in cells treated with IL-2 and IL-12 alone and in combination. B, Receptor expression in cells treated with IL-2 and IL-18 alone and in combination. In both A and B, cntl represents isotype control Ig staining. The data are from one representative experiment of two performed. Individual donors were used as the source of NK cells for each experiment.
Inhibition of CXCR3 expression by IL-2 and IL-12. Freshly isolated primary NK cells were stimulated with 100 U/ml IL-2, 10 U/ml IL-12, or 10 ng/ml IL-18, alone or in combination for 24 h and CXCR3 expression was compared with that observed in nontreated (NT) cells by flow cytometry analysis. A, Receptor expression in cells treated with IL-2 and IL-12 alone and in combination. B, Receptor expression in cells treated with IL-2 and IL-18 alone and in combination. In both A and B, cntl represents isotype control Ig staining. The data are from one representative experiment of two performed. Individual donors were used as the source of NK cells for each experiment.
Alterations in chemotaxis in cytokine-treated primary NK cells
The decrease in CXCR3 density in IL-2- and IL-12-treated NK cells predicted that these cells would have decreased migratory capacity in the presence of CXCR3-specific chemoattractants. To test this assumption, freshly isolated primary NK cells were treated with IL-2 and IL-12 alone or in combination for 24 h. Cells were placed into microchemotaxis chambers and their migration potential was evaluated in the presence of CXCR3 ligand, IFN-γ-inducible protein (IP)-10. At IP-10 concentrations of 100 ng/ml or greater, we observed a significant reduction in chemotaxis in the IL-2- and IL-12-treated cells (Fig. 6). Furthermore, the combination of IL-2 and IL-12 resulted in a substantial decrease in migration that was greater than that observed in cells treated with the cytokines alone (Fig. 6). Collectively, these data demonstrate that IL-2 and IL-12 can directly alter the chemotactic function of NK cells through changes in chemokine receptor mRNA and protein expression.
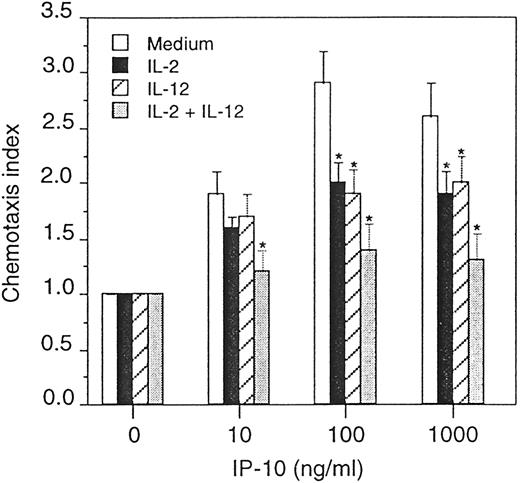
Effect of IL-2 and IL-12 on chemotaxis of primary NK cells. Freshly isolated primary NK cells were stimulated with 100 U/ml IL-2 and 10 U/ml IL-12, alone or in combination for 24 h. The NK cells were placed into the upper compartment of a microchemotaxis chamber while the chemoattractant, IP-10, was placed into the lower compartment at the various concentrations indicated. The amount of chemotactic activity was evaluated following a 4-h incubation. All results are expressed as the mean ± SD for triplicate determinations. Significant changes in migration as compared with medium alone are indicated by an asterisk (∗, p < 0.05). The data are from one representative experiment of two performed.
Effect of IL-2 and IL-12 on chemotaxis of primary NK cells. Freshly isolated primary NK cells were stimulated with 100 U/ml IL-2 and 10 U/ml IL-12, alone or in combination for 24 h. The NK cells were placed into the upper compartment of a microchemotaxis chamber while the chemoattractant, IP-10, was placed into the lower compartment at the various concentrations indicated. The amount of chemotactic activity was evaluated following a 4-h incubation. All results are expressed as the mean ± SD for triplicate determinations. Significant changes in migration as compared with medium alone are indicated by an asterisk (∗, p < 0.05). The data are from one representative experiment of two performed.
Down-regulation of CXCR3 mRNA expression
Decreases in CXCR3 density are evident by 24 h after IL-2 plus IL-12 treatment. Therefore, to understand the molecular mechanism responsible for these changes, we chose to examine the kinetic pattern of CXCR3 mRNA expression at times immediately following cytokine addition to NK cells. For these studies, primary human NK cells were isolated and changes in CXCR3 mRNA were monitored for up to 12 h following IL-2 plus IL-12 addition. In all donors tested, CXCR3 mRNA expression remained relatively unchanged for at least 3 h following cytokine treatment (Fig. 7, A and B). However, by 6 h of IL-2 plus IL-12 treatment, there was a slight 20% reduction in CXCR3 mRNA accumulation. The CXCR3 mRNA continued to decrease rapidly with time until a total 80% drop in expression was seen after 12 h of cytokine treatment. Interestingly, we found that IL-2 plus IL-12 did not negatively affect all chemokine receptors. The fractalkine receptor, CX3CR1 is expressed on NK cells and is involved in NK cell-mediated endothelial cell injury (28). In contrast to CXCR3, IL-2 plus IL-12 greatly enhanced CX3CR1 mRNA expression (Fig. 7 A). By 3 h of IL-2 plus IL-12 treatment, CX3CR1 mRNA increased 3-fold. The increase in mRNA expression continued to rise with a 4-fold increase after 6 h of cytokine treatment. Moreover, this increase in mRNA was sustained throughout the remainder of the time course.
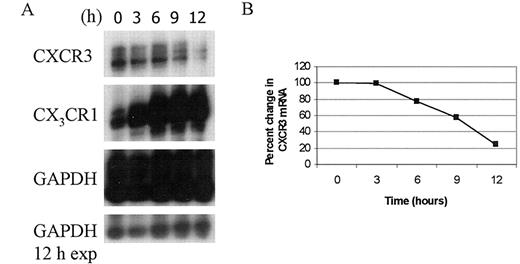
Kinetics of CXCR3 mRNA accumulation in primary human NK cells. A, Freshly isolated NK cells were treated with IL-2 (100 U/ml) plus IL-12 (10 U/ml) for the times indicated. Total mRNA was isolated and CXCR3 and CX3CR1 mRNAs were measured by RPA analysis using a hCR6 multiprobe. GAPDH was included as a control for sample-to-sample variation. A 24-h exposure is shown for all mRNAs. A 12-h exposure (exp) of GAPDH mRNA is included to demonstrate sample and gel loading variations. B, Graphical representation of the percent change in CXCR3 mRNA shown in A. The amount of CXCR3 mRNA at time 0 was arbitrarily assigned as 100%. This experiment is representative of three independent assays performed on three separate donors.
Kinetics of CXCR3 mRNA accumulation in primary human NK cells. A, Freshly isolated NK cells were treated with IL-2 (100 U/ml) plus IL-12 (10 U/ml) for the times indicated. Total mRNA was isolated and CXCR3 and CX3CR1 mRNAs were measured by RPA analysis using a hCR6 multiprobe. GAPDH was included as a control for sample-to-sample variation. A 24-h exposure is shown for all mRNAs. A 12-h exposure (exp) of GAPDH mRNA is included to demonstrate sample and gel loading variations. B, Graphical representation of the percent change in CXCR3 mRNA shown in A. The amount of CXCR3 mRNA at time 0 was arbitrarily assigned as 100%. This experiment is representative of three independent assays performed on three separate donors.
To understand whether CXCR3 mRNA regulation was entirely due to transcriptional changes, we determined the half-life of the CXCR3 mRNA in the presence and absence of the transcriptional inhibitor, actinomycin D. For these experiments, NK92 cells were treated with IL-2 plus IL-12 ± actinomycin D and changes in CXCR3 mRNA were measured at various times posttreatment. As IL-2 plus IL-12 reduces the quantity of CXCR3 mRNA, the amount of CXCR3 mRNA measured at all times was expressed as a percentage of that observed at the initial time of cytokine addition. In the absence of actinomycin D, NK92 cells responded to IL-2 plus IL-12 with the expected reduction in CXCR3 mRNA (Fig. 8, A and B). Under these conditions, the CXCR3 mRNA half-life was estimated to be 1.5 h (Fig. 8,B). The addition of actinomycin D slightly increased the half-life of the CXCR3 mRNA from 1.5 to 2 h (Fig. 8 B). This slight increase in the mRNA half-life was surprising in that mRNA stabilization, in the absence of other factors, should lead to an overall increase in mRNA accumulation. However, we found that IL-2 plus IL-12 act collectively to decrease CXCR3 expression. Although this small increase in CXCR3 mRNA half-life suggests that posttranscriptional effects may contribute to the regulation of CXCR3 expression, it should be noted that the overall increase in mRNA half-life is small and that the rate of CXCR3 mRNA decay is similar in the absence or presence of actinomycin D. Thus, the overall increase in CXCR3 mRNA half-life may be insignificant and other as yet unknown factors may contribute to the down-regulation of CXCR3 expression.
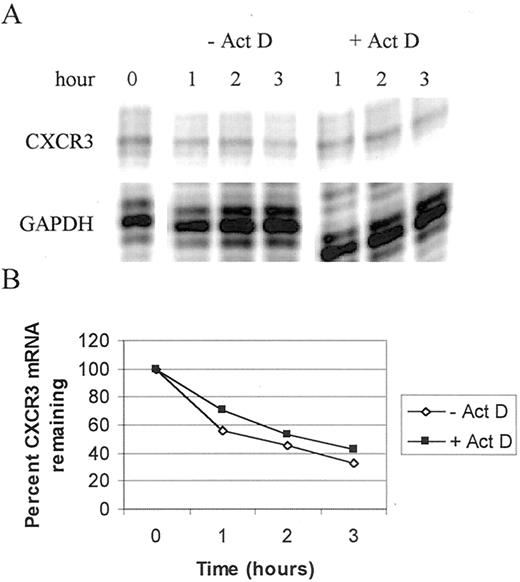
Half-life of CXCR3 mRNA in IL-2 plus IL-12-treated NK92 cells. A, NK92 cells were rested overnight without IL-2 and IL-15 and then treated with IL-2 (100 U/ml), IL-12 (10 U/ml) ± actinomycin D (5 μg/ml) for the times indicated. Total mRNA was isolated from the cells and a multiprobe RPA analysis was performed with a hCR-6 probe set. GAPDH was included as an internal control for sample-to-sample variation. The gel was exposed to a PhosphorImager screen for 24 h. B, Graphical representation of the quantitation performed by ImageQuant analysis of the image shown in A. The amount of CXCR3 mRNA at time 0 was arbitrarily set to 100%. The experiment is one of three separate assays, all with similar results.
Half-life of CXCR3 mRNA in IL-2 plus IL-12-treated NK92 cells. A, NK92 cells were rested overnight without IL-2 and IL-15 and then treated with IL-2 (100 U/ml), IL-12 (10 U/ml) ± actinomycin D (5 μg/ml) for the times indicated. Total mRNA was isolated from the cells and a multiprobe RPA analysis was performed with a hCR-6 probe set. GAPDH was included as an internal control for sample-to-sample variation. The gel was exposed to a PhosphorImager screen for 24 h. B, Graphical representation of the quantitation performed by ImageQuant analysis of the image shown in A. The amount of CXCR3 mRNA at time 0 was arbitrarily set to 100%. The experiment is one of three separate assays, all with similar results.
Discussion
NK cells play a pivotal role in protecting the body against infectious agents and cancers (1, 29, 30). Thus, cytokine-induced variations in gene expression in NK cells may have profound effects on NK cell biology and immune response. In this study, we have examined global changes in gene expression in response to IL-2 alone and in combination with IL-12 or IL-18 and found that 82 genes changed at least 2-fold in response to cytokine treatment. Collectively, alterations in mRNA expression were associated with genes whose protein products are involved with multiple cellular functions such as, cell cycle progression, signal transduction, transcriptional activation, and mRNA processing. However, the majority of genes that responded to cytokine treatment code for chemokines, chemokine receptors, and cytokines.
Of the altered chemokine receptor genes identified, we chose to further investigate the effect of IL-2 and IL-12 on CXCR3 expression. Cellular distribution of CXCR3 is mainly localized to activated T cells, eosinophils, basophils, and NK cells but control of this expression is poorly understood. Alterations in CXCR3 receptor and mRNA expression have been studied in IL-2-treated T and NK cells (9, 31); however, cells were incubated in the presence of IL-2 for many days before mRNA analysis was made. This demonstrated the long-term effects of IL-2, but did not address rapid short-term effects of cytokines on CXCR3 expression.
Our data show that IL-12 and IL-2 alone and in combination effectively down-regulate CXCR3 cell surface expression in NK cells. Furthermore, alterations in CXCR3 mRNA precede changes in protein expression suggesting that changes in CXCR3 surface expression are due to rapid changes in mRNA accumulation and are not due to receptor internalization. Initially, we observed an IL-2 plus IL-12 mediated down-regulation of CXCR3 mRNA expression in NK92 cells. This observation was extended to primary human NK cells. The kinetics of IL-2 plus IL-12 down-regulation of CXCR3 mRNA in primary NK cells demonstrated that CXCR3 mRNA expression was relatively constant after 3 h of cytokine treatment; however, by 6 h, an ∼25% decrease in mRNA accumulation was seen. At times following, CXCR3 mRNA continued to decline. The decline in CXCR3 mRNA was also observed in NK92 cells but was more rapid with a significant decline visualized by 3 h of IL-2 plus IL-12 treatment. The difference in decay rates between NK92 and primary NK cells did not affect the overall outcome of CXCR3 down-regulation and may reflect differences in cultured and primary cells.
To closely examine the mechanism of CXCR3 mRNA regulation, we conducted CXCR3 mRNA half-life studies with actinomycin D to determine whether regulation was entirely due to transcriptional effects. We expected that the transcriptional blocker, actinomycin D, would either have no effect or would shorten the half-life of CXCR3 mRNA as an increase in CXCR3 mRNA half-life would reflect a mRNA stabilization event that should ultimately lead to an increase in mRNA accumulation. Surprisingly, we found that concurrent addition of actinomycin D, IL-2, and IL-12 to NK92 cells slightly increased the half-life of the CXCR3 mRNA suggesting that these cytokines have a stabilizing effect on the CXCR3 mRNA. These data demonstrate that IL-2 plus IL-12 control of CXCR3 mRNA expression is not entirely at the transcriptional level and that as yet unknown posttranscriptional effectors must negate any stabilization effect of IL-2 plus IL-12 on CXCR3 mRNA so that accumulation is ultimately reduced.
Overall, our data suggest that IL-2 and IL-12 alone or in combination have the ability to modulate immune function by altering CXCR3 receptor expression on NK cells. This is particularly important because NK cells are primary cellular defenders against viral infections and viral infections induce cellular release of potent cytokines and chemokines. The chemokine MIP-1α is a potent inducer of NK cell chemotaxis (32, 33) and has been shown to induce NK cell migration to livers of murine CMV-infected mice (34). Once in the liver, NK cells produce IFN-γ in an IL-12-dependent fashion that in turn up-regulates the expression of CXCR3 receptor ligands monocyte interferon-γ-inducible protein, IFN-γ-inducible T-cell α chemoattractant, and IP-10 (34, 35, 36, 37). Concurrent with the IL-12 up-regulation of IFN-γ, it is possible that IL-12 alone or in combination with IL-2 down-regulates CXCR3 expression on NK cells thus reducing NK cell chemotactic responsiveness to CXCR3 ligands. As monocyte interferon-γ-inducible protein, IFN-γ-inducible T-cell α chemoattractant, and IP-10 can promote the migration of activated Th1 lymphocytes to inflammatory sites, these chemokines may then initiate a secondary T cell-mediated immune response. This model illustrates how IL-12 alone and in combination with IL-2 may trigger both primary and secondary immune responses, thus profoundly affecting NK cell biology and immune responses.
Acknowledgements
We thank William Bere and Stephanie Krebs for their assistance with primary NK cell isolation and RPAs. We are also indebted to Wanghua Gong for her assistance with the chemotaxis assays.
Footnotes
This project has been funded in whole or in part with Federal funds from the National Cancer Institute, National Institutes of Health under Contract No. N01-CO-12400. The publisher or recipient acknowledges the right of the U. S. Government to retain a nonexclusive, royalty-free license in and to copyright covering the article. The content of this publication does not necessarily reflect the views or policies of the Department of Health and Human Services, nor does mention of trade names, commercial products, or organizations imply endorsement by the U. S. Government.
Abbreviations used in this paper: RPA, RNase protection assay; GBP-1, guanylate binding protein 1; SLP-76, Src homology 2 domain-containing leukocyte protein of 76 kD; MIP, macrophage-inflammatory protein; MX1, myxovirus resistance 1; PI3K, phosphoinositide-3-kinase; IP-10, IFN-γ-inducible protein-10.
