

Abstract
Tid1, a DnaJ cochaperone protein, is the mammalian homologue of the Drosophila tumor suppressor Tid56 whose antitumor function is most likely mediated through its capacity to regulate cell differentiation in imaginal discs. We suspected that the mammalian counterpart, tid1, may also be involved in regulating cell differentiation. To investigate this, we exploited the system of T cell development to examine whether tid1 plays a role in this well-defined process. Mice with tid1 specifically deleted in T cells developed thymic atrophy, with dramatic reduction of double-positive and single-positive thymocytes in the tid1−/− thymus. Although the subpopulations of tid1−/− double-negative (DN) 1–3 thymocytes were normal, the subpopulation of DN4 thymocytes was measurably smaller because of reduced proliferation and significant cell death. Immature tid1−/− thymocytes show normal VDJ β-chain rearrangement and pre-TCR and CD3 expression in both DN3 and DN4 thymocytes, but in DN4 thymocytes, there was significantly reduced expression of the antiapoptotic bcl-2 gene. Restoring the expression level of Bcl-2 protein in tid1−/− thymus by introduction of a transgenic human bcl-2 gene resulted in reversal of the developmental defects in tid1−/− thymus. Together, these results demonstrate that tid1 is critical in early thymocyte development, especially during transition from the DN3 to double-positive stages, possibly through its regulation of bcl-2 expression, which provides survival signals.
Cell fate determination is a key to development. In fact, it is the proper cell number and variety of different cell types that determine and maintain the complex physiological functions of a multicellular organism. T cell development in the thymus is one of the most sophisticated processes in mammals, with T cells maturing from incoming bone marrow-derived progenitor cells to mature T cells by a precisely organized sequence of cellular differentiation, cellular proliferation, and cell death events. T cells undergo a series of well-documented differentiation steps, which are defined according to the expression of CD4 and CD8 cell surface markers, beginning as CD4−CD8− double-negative (DN), 3 then becoming CD4+CD8+ double-positive (DP), and finally maturing into single-positive (SP) CD4+ or CD8+ T cells (1). The DN stage can be further subdivided into DN1–4 stages by CD25 and CD44 expression. The DN1 cells, the earliest CD4−CD8− DN thymocytes, express CD44, but not CD25 (CD44+ CD25−). Maturation of the DN1 thymocytes then proceeds from the DN2 stage (CD44+CD25+) to the DN3 stage (CD25+CD44−), to the DN4 stage (CD25−CD44−) (1). At the DN3 stage, TCR β-chain rearrangement occurs that results in the expression of a functional pre-TCR that subsequently facilitates β selection (2). The signals provided by the pre-TCR (2, 3), cytokine receptors (4, 5), and other influences from the microenvironment (4, 5, 6, 7) lead to the proliferation, survival, and differentiation of DN thymocytes to the CD4+CD8+ DP stage. DP thymocytes bearing a functional TCR β-chain subsequently rearrange and express the TCR α-chain (2). DP thymocytes with a mature TCRαβ-CD3 complex, then further differentiate to CD4+ or CD8+ SP cells (2).
The Drosophila l(2)tid gene, tid56, is the first and only member of the DnaJ cochaperone family that has been classified as a tumor suppressor (8, 9). The null mutation of the tid56 gene not only keeps imaginal discs from differentiating, but also leads to lethal tumorigenesis during the early developmental larval stage, suggesting that during embryogenesis, tid56 is involved in regulating cell differentiation, cell growth, and cell death (8, 9). The biological function of its mammalian counterpart, tid1 (10), in mammalian development, however, is poorly characterized. As a DnaJ protein, Tid1 serves as a cochaperone and regulatory factor for the 70-kDa heat shock protein family of molecular chaperones (11) and is characterized by a J domain, a highly conserved tetrahelical domain that binds to 70-kDa heat shock proteins to regulate their activity and provide substrate specificity (11). Because tid56, the Drosophila counterpart of tid1, exerts its antitumor function most likely through its role in regulating cell differentiation (8), we suspected that tid1 may also be involved in regulating cell differentiation in mammals. Loss of tid1 leads to embryonic lethality as early as embryonic day 4.5 (12), precluding investigating Tid1’s role in most cell types. Because T cell differentiation in mammals is a well-characterized process, we investigated whether tid1 is involved in this process by specifically inactivating the tid1 gene in T cells by crossing tid1-floxed mice with lck-cre transgenic mice (13). The resultant lck-tid1f/f mice showed thymic atrophy with significant reduction in thymocytes, resulting from decreased proliferation and increased cell death at the DN4 stage. We also discovered that expression of the antiapoptotic bcl-2 gene in lck-tid1f/f DN4 cells was dramatically reduced. We compensated this Bcl-2 insufficiency with a human (h) bcl-2 transgene (14) and consequently restored thymocyte production and development in lck-tid1f/f thymus. These data suggest a role for Tid1 in T cell survival and proliferation from the DN to DP stages through its regulation of Bcl-2 expression.
Materials and Methods
Generation of lck-tid1f/f mice
Mice bearing conditional deletion of tid1 in thymocytes and T cells were generated by breeding mice bearing a loxP-flanked tid1 gene (12) (mixed background) with lck-Cre mice (13) (C57BL/6). In all experiments, littermate mice containing at least one allele of wild type or floxed Tid1 were used as negative controls. All animal protocols were in full compliance with the guidelines for animal care and were approved by the animal care committee of the institution.
Flow cytometric analysis and cell sorting
In brief, single-cell suspensions of thymocytes, splenocytes, and lymphocytes from lymph nodes were prepared, and 1–2 × 10⁶ cells were incubated with mAbs in PBS containing 2% FCS and 0.2% NaN3 for 20 min at 4°C. Anti-CD4, -CD8, -CD25, -CD44, -Thy1, -B220, -CD11b, -NK1.1, -TCRβ, -TCRγδ, -TER-119, -Mac-1, -Gr-1, -mouse (m) Bcl-2, and -hBcl-2 mAbs were obtained from BD Biosciences. These mAbs were directly coupled to FITC, PE, PE-Cy7, allophycocyanin, allophycocyanin-Cy7, or biotin. Surface marker expression by thymocytes and peripheral T cells was analyzed using a flow cytometer (FACSCalibur or Digital LSRII; BD Biosciences) and FlowJo (TreeStar) software according to standard protocols. Biotinylated Abs were revealed with streptavidin-PE, streptavidin-PerCP-Cy5.5, or streptavidin-allophycocyanin (BD Biosciences). Dead cells and debris were excluded by appropriate gating of forward and side scatters. For DN thymocyte analysis, cells were stained with biotinylated Abs specific for mouse CD4, CD8, B220, CD11b, NK1.1, TCRγδ, TER-119, Mac-1, and Gr-1, lineage markers (Lin), followed by streptavidin-allophycocyanin, anti-CD25-PE-Cy7, and anti-CD44-FITC staining. DN thymocytes were then defined by excluding allophycocyanin+ (Lin−) cells during the subsequent analysis, and DN1–4 thymocytes were sorted as following (DN1, Lin−CD44+CD25−; DN2, Lin−CD44+CD25+; DN3, Lin−CD44−CD25+; DN4, Lin−CD44−CD25−). Cell sorting was performed using a FACSVantage DiVa flow cytometer (BD Biosciences). Intracellular hBcl-2 or mBcl-2 was stained according to the protocol of the BD Cytofix/Cytoperm kit (BD Biosciences).
Cell cycle analysis
Cell cycle analysis of thymocytes was performed using the BrdU Flow Kit (BD Biosciences). Mice were injected i.p. with 1 mg of BrdU 2 h before sample preparation. Cells were prepared, stained with cell surface markers followed by anti-BrdU Abs and 7-aminoactinomycin D (7AAD; BD Biosciences), and analyzed by flow cytometry.
TCRβ rearrangement PCR
DN thymocyte subsets (isolated, stained, and sorted, as described above) were collected. PCR for TCRβ rearrangements and Thy1 was performed as previously described (15) on total cell lysates. After 40 cycles of amplification (1 min at 94°C, 2 min at 56°C, 3 min at 68°C), PCR products were separated on a 1.5% agarose gel.
RNA extraction and real-time RT-PCR
Total RNA was extracted from thymocytes using the RNeasy kit (Qiagen). cDNA was generated with the SuperScript First-Strand Synthesis System (Invitrogen Life Technologies) with random hexamer primers. The RT reaction was subsequently used as a template for real-time PCR. Real-time PCR assays were performed on an ABI 7700 thermocycler using SYBR Green PCR Master Mix (Applied Biosystems) according to the manufacturer’s protocol. Specific primers, designed with the PrimerExpress software (Applied Biosystems), are as follows: tid1, 5′-CGAAATGCCAGCCAGAAA-3′ (sense), and 5′-GCGCTCACAGGTATCCATAA-3′ (antisense) or were referred from the database of PrimerBank in GenBank as follows: bcl-2, PrimerBank ID 6753168a1; CD3ε, PrimerBank ID 6680886a3; GAPDH, PrimerBank ID 6679939a2; IL-7R, PrimerBank ID 11362612a1; JAK3, PrimerBank ID 537607a2; and pTα, PrimerBank ID 6755216a1. Primer sets for PCR of BAG1 and MEK7 genes were described previously (12). Data were normalized to the housekeeping gene GAPDH.
Results
Generation of thymocyte-specific Tid1-deficient mice
To determine the role of tid1 during early intrathymic development, tid1 gene floxed mice (tid1f/f) (12) were crossed with transgenic mice expressing the cre recombinase gene under the control of the lck proximal promoter (13) to obtain thymocyte-specific inactivation of tid1 in the thymus of mutant mice (lck-tid1f/f) (Fig. 1, A and B). Genomic DNA was prepared from sorted DN cells of different thymocyte subsets, and PCR was performed using a set of primers (as indicated by arrows in Fig. 1,A) to distinguish between the floxed and deleted tid1 alleles (Fig. 1,C). Deletion of the tid1 gene in lck-tid1f/f mice started at the DN1 stage. The floxed allele was inactivated in the majority of DN2 cells and was completed by the DN3 stage (CD44−CD25+; Fig. 1,C). Littermates of the mutant lck-tid1f/f mice containing at least one copy of functional tid1 gene (wild type or floxed allele) were used as controls for the following studies (Fig. 1 B).

T cell-specific inactivation of the tid1 gene in immature thymocytes causes thymic atrophy. A, Mice carrying a floxed tid1 allele were bred with lck-Cre transgenic mice to generate T cell-specific deletion of tid1 in thymocytes. Top, Floxed tid1 allele (undeleted); bottom, lck-tid1f/f allele (deleted). a and b, PCR primers used to distinguish these two alleles. Arrows indicate the region of DNA amplified in the PCR. B, Genotyping of mice carrying wild-type Tid1 allele, Tid1-floxed allele, or lck-Cre transgenic allele by PCR analysis. C, PCR analysis for tid1 gene deletion of the indicated thymocyte subsets (DN1-DN4) isolated from either control (lck tid1+/+) or mutant (lck-tid1f/f) mice. The undeleted allele was amplified as a 1137-bp band, and the deleted allele was amplified as a 423-bp band. D, Gross morphology of lck-tid1+/+control (left) vs lck-tid1f/f mutant (right) mice. Thymus (T), heart (H), and lung (L) are indicated. Lower panel, Complete thymi from either control (lower left) or mutant (lower right) mice. E, H&E-stained section of control (two left panels) and mutant (two right panels) thymi demonstrated loss of corticomedullary (M, medulla; Cx, cortex) architecture in mutant thymus.
T cell-specific inactivation of the tid1 gene in immature thymocytes causes thymic atrophy. A, Mice carrying a floxed tid1 allele were bred with lck-Cre transgenic mice to generate T cell-specific deletion of tid1 in thymocytes. Top, Floxed tid1 allele (undeleted); bottom, lck-tid1f/f allele (deleted). a and b, PCR primers used to distinguish these two alleles. Arrows indicate the region of DNA amplified in the PCR. B, Genotyping of mice carrying wild-type Tid1 allele, Tid1-floxed allele, or lck-Cre transgenic allele by PCR analysis. C, PCR analysis for tid1 gene deletion of the indicated thymocyte subsets (DN1-DN4) isolated from either control (lck tid1+/+) or mutant (lck-tid1f/f) mice. The undeleted allele was amplified as a 1137-bp band, and the deleted allele was amplified as a 423-bp band. D, Gross morphology of lck-tid1+/+control (left) vs lck-tid1f/f mutant (right) mice. Thymus (T), heart (H), and lung (L) are indicated. Lower panel, Complete thymi from either control (lower left) or mutant (lower right) mice. E, H&E-stained section of control (two left panels) and mutant (two right panels) thymi demonstrated loss of corticomedullary (M, medulla; Cx, cortex) architecture in mutant thymus.
T cell-specific tid1 inactivation results in abnormal thymic development
Gross dissection of lck-tid1f/f mutant animals revealed severe thymic atrophy. The overall size of the mutant thymus was markedly reduced compared with the large, bilobed thymus observed in control littermates (lck-tid1+/+) at 3 wk of age (Fig. 1,D). Cell counts showed a dramatic reduction of ∼50-fold in total thymocytes present in the mutant thymus, indicating a T cell development defect (37.3 ± 10.4 × 10⁵ cells in lck-tid1f/f vs 1812.5 ± 356.8 × 10⁵ cells in lck-tid1+/+, in 3- to 6-wk-old thymus; Table I). In support of this finding, histological analysis showed thymi of lck-tid1f/f mice were much smaller and lacked cortex medulla compartmentalization (compare left and right panels in Fig. 1,E), consistent with previous reports suggesting that defective T cell development inhibits correct formation and maintenance of thymic medulla (16). Except for the significant difference in thymus size, there were no discernible differences between mutant and control mice upon gross observation until the age of 10 mo, and lck-tid1f/f mutant mice were fertile during this period. Moreover, littermate controls with one or two functional tid1 alleles (tid1+/+, lck-tid1+/+, tid1f/+, lck-tid1f/+, and tid1f/f) showed no differences in the composition of thymic cellularity regardless of the presence or the absence of the lck-cre transgene (Table I).
Absolute cell number of thymocyte subpopulations in week 3–6 micea
| Mouse | No. of Cells in Thymus | ||||||||
|---|---|---|---|---|---|---|---|---|---|
| Total | DN | DP | CD8 SP | CD4 SP | |||||
| Tid1+/+ (n = 4) | 1675.0 ± 455.5 | 50.1 ± 15.4 | 1397.0 ± 392.1 | 76.3 ± 21.5 | 148.3 ± 59.1 | ||||
| Lck-Tid1+/+ (n = 4) | 1812.5 ± 356.8 | 51.2 ± 20.6 | 1513.2 ± 343.7 | 67.3 ± 12.4 | 182.6 ± 26.0 | ||||
| Tid1f/+ (n = 4) | 1825.0 ± 379.7 | 53.7 ± 15.6 | 1515.6 ± 326.1 | 78.1 ± 36.2 | 171.5 ± 65.3 | ||||
| Lck-Tid1f/+ (n = 4) | 1787.5 ± 201.5 | 57.7 ± 22.8 | 1488.3 ± 222.0 | 77.3 ± 11.0 | 157.5 ± 30.9 | ||||
| Tid1f/f (n = 4) | 1612.5 ± 356.8 | 53.5 ± 19.3 | 1294.6 ± 315.6 | 78.3 ± 18.3 | 177.5 ± 19.8 | ||||
| Lck-Tid1f/f (n = 4) | 37.3 ± 10.4b | 32.8 ± 12.5 | 1.9 ± 1.3b | 0.7 ± 0.4b | 1.9 ± 0.8b | ||||
Values are the mean ± SD × 105.
p < 0.001 compared with control mouse; p values were calculated by t test.
Defects in thymocyte development in lck-tid1f/f mice
FACS analysis of a number of stage-specific cell surface markers was performed on thymocytes from mutant lck-tid1f/f mice vs control lck-tid1+/+mice. The forward/side scatter spectra showed ∼40% of thymocytes of lck-tid1f/f mice were smaller and more granular than the thymocytes of lck-tid1+/+mice (Fig. 2,A) suggesting that this group of thymocytes from lck-tid1f/f thymus contained many dead or dying cells, and that cell death may be responsible for the thymic atrophy in mutant mice. These dead or dying cells in mutant thymus mostly stained positive for the surface marker, Thy1, suggesting that these cells were originally of thymocyte lineage (data not shown). In addition to the dramatic reduction of total thymocytes in mutant thymus (Table I), strikingly, anti-CD4/CD8 staining revealed an almost complete loss of DP (CD4+CD8+) and SP (CD4 SP, CD4+CD8− and CD8 SP, CD4−CD8+) cell populations, leaving the majority (90%) of cells in the mutant thymus as DN (CD4−CD8−) cells (Table I and Fig. 2,B). In absolute numbers per thymus, DP thymocytes were reduced ∼600-fold, CD4 SP ∼60-fold, and CD8 SP ∼50-fold, whereas the total population of DN cells was not significantly affected (Table I). Double staining with anti-TCRβ and anti-TCRγδ in control and mutant thymocytes showed, percentagewise, fewer high and intermediate β-chain-expressing thymocytes, but more γδ-chain-positive T cells in mutant mice (Fig. 2, C and D). Taking into account the reduction in total number of mutant thymocytes, the absolute number of γδ-chain-positive thymocytes in mutant mice did not change significantly from that in control animals (data not shown), although the absolute number of β-chain-positive thymocytes in mutant thymus was 75-fold less than that in control thymus (data not shown). These data demonstrated that lck-tid1f/f thymus lacked DP and SP T cells, but contained relatively normal amounts of TCRγδ T cells and immature DN T cells.

T cell development is blocked at the DN stages in lck-tid1f/f mice. A, The cell size of thymocytes was shown by forward scatter (FSC) vs side scatter (SSC) spectra, and the absolute number of control and mutant thymocytes was shown on the top of the spectra. Expression profiles of CD4 vs CD8 (B) and TCRβ vs TCRγδ (C) of thymocytes were analyzed by flow cytometry in lck-tid1+/+and lck-tid1f/f littermates. The TCR β-chain-expressing thymocytes were classified as high (hi) or intermediate (in) according to the expression level of TCRβ on the cell surface. D, Profiles of the TCRβ- and TCRγδ-positive populations in both control and mutant thymi. The absolute number of thymocytes from mutant and control thymi, excluding the gated dead or dying cells, was shown on top of the spectra (B and C). Numbers in gates and quadrants indicate the percentage of cells in these areas.
T cell development is blocked at the DN stages in lck-tid1f/f mice. A, The cell size of thymocytes was shown by forward scatter (FSC) vs side scatter (SSC) spectra, and the absolute number of control and mutant thymocytes was shown on the top of the spectra. Expression profiles of CD4 vs CD8 (B) and TCRβ vs TCRγδ (C) of thymocytes were analyzed by flow cytometry in lck-tid1+/+and lck-tid1f/f littermates. The TCR β-chain-expressing thymocytes were classified as high (hi) or intermediate (in) according to the expression level of TCRβ on the cell surface. D, Profiles of the TCRβ- and TCRγδ-positive populations in both control and mutant thymi. The absolute number of thymocytes from mutant and control thymi, excluding the gated dead or dying cells, was shown on top of the spectra (B and C). Numbers in gates and quadrants indicate the percentage of cells in these areas.
Tid1 deficiency impairs cell proliferation and enhances cell death of DN4 cells
In Fig. 2,B, we showed that almost 90% of the T cells in mutant thymus were DN, suggesting that the loss of tid1 affected either the differentiation of DN cells or the DN to DP transition. To distinguish between these possibilities, DN cells from control and mutant thymi were stained for the early developmental cell surface markers, CD25 and CD44 (Fig. 3,A). DN3 (CD25+ CD44−) cells represented ∼60% of lck-tid1f/f DN cells compared with <30% in lck-tid1+/+mice. DN4 (CD25− CD44−) cells were reduced to 34% in lck-tid1f/f thymus compared with ∼70% in lck-tid1+/+ thymus. The absolute number of DN3 cells from both control and mutant thymi were about the same, but the absolute number of DN4 cells of mutant thymus was significantly reduced compared with that of control thymus (DN3: control vs mutant, 17.3 × 10⁵ vs 13.5 × 10⁵; DN4: control vs mutant, 43.5 × 10⁵ vs 7.7 × 10⁵). Further dividing the DN3 thymocyte into DN3 L and DN3 E by size according to the forward scatter analysis (3), we did not see a significant difference in the distribution of these two cell types between control and mutant mice (Fig. 3,B). However, 93% of the DN4 cells from mutant thymus were small cells, which was slightly higher than that from control thymus (Fig. 3 C), suggesting less DN4 cell proliferation in mutant thymus. Thus, we suspected that the decrease in DN4 T cells in mutant thymus could be caused by either decreased cell proliferation and/or enhanced cell death in DN4 cells.
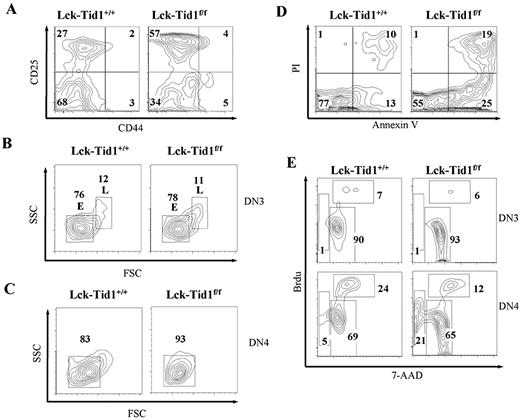
Tid1 deficiency increases cell death and reduces cell proliferation in DN4 cells. A, Profiles of DN thymocytes from control and lck-tid1f/f mice stained with CD25 and CD44 Abs. Numbers in quadrants indicate the percentages of DN1–4 (DN1, CD44+ CD25−; DN2, CD44+CD25+; DN3, CD25+CD44−; DN4, CD25−CD44−) cells within these areas. B, DN3 thymocytes of control and mutant thymi were further separated, according to size, into small E cells and large β-selected L cells. C, DN4 thymocytes were analyzed by forward (FSC) and side (SSC) scatter flow cytometry. D, DN thymocytes stained with PI and annexin V. Numbers in quadrants indicate the percentages of cells in these areas. E, Flow cytometric analysis of DN3 (upper panel) and DN4 (lower panel) thymocytes for BrdU incorporation (cell proliferation) and 7-AAD staining (DNA content). Numbers in gated areas indicate the percentages of cells.
Tid1 deficiency increases cell death and reduces cell proliferation in DN4 cells. A, Profiles of DN thymocytes from control and lck-tid1f/f mice stained with CD25 and CD44 Abs. Numbers in quadrants indicate the percentages of DN1–4 (DN1, CD44+ CD25−; DN2, CD44+CD25+; DN3, CD25+CD44−; DN4, CD25−CD44−) cells within these areas. B, DN3 thymocytes of control and mutant thymi were further separated, according to size, into small E cells and large β-selected L cells. C, DN4 thymocytes were analyzed by forward (FSC) and side (SSC) scatter flow cytometry. D, DN thymocytes stained with PI and annexin V. Numbers in quadrants indicate the percentages of cells in these areas. E, Flow cytometric analysis of DN3 (upper panel) and DN4 (lower panel) thymocytes for BrdU incorporation (cell proliferation) and 7-AAD staining (DNA content). Numbers in gated areas indicate the percentages of cells.
To determine whether apoptosis is enhanced in mutant thymus, DN T cells from control and mutant thymi were double stained with propidium iodide (PI) and annexin V. The percentage of PI and annexin V DP T cells from mutant DN cells was twice that in control DN cells (mutant vs control, 19 vs 10%; Fig. 3,D). The number of annexin V SP DN T cells in mutant thymus was also twice as high as that in control thymus (mutant vs control, 25 vs 13%; Fig. 3 D). These results suggested that more DN cells in mutant thymus were undergoing programmed cell death than in control thymus.
Because DN4 T cells are the highly proliferative DN cells (17), the lack of proliferation of DN4 T cells in mutant thymus may also explain the low percentage of DN4 cells in mutant thymus. Using both BrdU incorporation and 7-AAD staining, we examined the proliferation rate and the apoptosis of DN3 and DN4 subpopulations of T cells in both mutant and control thymi. We did not see much difference in BrdU incorporation between control and mutant thymi in their DN3 cells (Fig. 3,E, upper panel). However, in the DN4 T cells of control lck-tid1+/+ thymus, there were twice as many cells in S phase as in lck-tid1f/f thymus (Fig. 3,E, lower panel; S phase DN4 of control vs mutant, 24 vs 12%). Interestingly, there were ∼21% DN4 mutant thymocytes and only 5% DN4 control thymocytes in the subdiploid phase (Fig. 3,E, lower panel). This increase in the subdiploid population in mutant DN4 T cells suggested that there were more DN4 T cells of mutant mice undergoing apoptosis than in controls. The considerable increase in cell death in mutant DN4 T cells together with the fact that DN T cells were the major T cells in lck-tid1f/f thymus may explain the presence of the dying population within the thymus of mutants suggested by forward/side scatter spectrum analysis (Fig. 2 A).
These data implied that a combination of increased cell death and reduced cell proliferation in mutant DN4 T cells caused the overall decrease in the DN4 subpopulation in lck-tid1f/f thymus and the consequent impairment of T cell development from DN to DP.
Tid1 is not required for β-chain rearrangement and pre-TCR-CD3 complex formation
Rearrangement of the β-chain is a crucial checkpoint in DN3 T cells. Without successful β-chain rearrangement, DN3 T cells from pTα−/−, RAG1−/− or Notch1−/− thymus are arrested and accumulate in this stage without further T cell development (18, 19). To test whether deletion of tid1 impairs the β-chain rearrangement in lck-tid1f/f mutant DN3 cells, DN3 (CD44−CD25+) and DN4 (CD44−CD25−) T cells of lck-tid1+/+and lck-tid1f/f thymocytes were sorted by the cell surface markers CD4, CD8, CD25, and CD44 and genomic DNA from DN3 and DN4 cells was used as template for PCR analysis. PCR analysis on genomic DNA from lck-tid1f/f DN3 and DN4 cells showed successful Dβ-Jβ-chain rearrangement similar to that of control DN3 and DN4 T cells, whereas DNA from a tail biopsy gave a much larger germline product in Dβ-Jβ-chain rearrangement analysis (Fig. 4,A). For Vβ-DJβ-chain rearrangement analysis, we detected partial rearrangement on both control and mutant DN3 cells and more successful rearrangement on control and mutant DN4 cells. There was no product at all from the control tail DNA in Vβ-DJβ-chain rearrangement analysis (Fig. 4,B). The different frequencies of Vβ-DJβ-chain rearrangement among DN3 and DN4 thymocytes may be the result of selection in which only those thymocytes with productive TCRβ progress past the DN3 stage (20). FACS staining the surface TCRβ showed high TCRβ in the mutant DN4 thymocytes, suggesting that without tid1 this unusual mature DN4 cell could be a specific feature of abnormal T cell development in lck-tid1f/f mice (Fig. 4 C).

T cell-specific deletion of tid1 allows lck-tid1f/f thymocytes to undergo β-chain rearrangement, but affects the expression profile of genes involved in cytokine receptor signaling in DN4 T cells. Genomic DNA was isolated from sorted DN3 and DN4 thymocytes from lck-tid1+/+ and lck-tid1f/f mice. DNA was analyzed for the presence of TCRβ rearrangements using primers with specificity for Dβ-Jβ joints (A) or Vβ-DJβ joints (B). The Thy1 gene was used as an internal control for total DNA loading. C, Histograms of DN4 thymocytes from lck-tid1+/+ and lck-tid1f/f mice stained with TCRβ. Control mice (solid line) and mutant mice (gray-filled and dashed line) are shown. The negative control is indicated by a dotted line. RT and real-time PCR analyses of genes of interest were used to evaluate the gene expression patterns in DN3 (D) and DN4 (E) T cells derived from control, lck-tid1+/+, or lck-tid1f/f mice. Total RNA was isolated, and RT was performed to synthesize first-strand cDNA. Primer sets specific for tid1, CD3ε, pTα, IL-7R, Jak3, bcl-2, BAG1, and MEK7 were synthesized to assess expression profiles of these genes in DN3 or DN4 cells, as indicated. The housekeeping gene GAPDH was used as an internal control for DNA loading. The relative quantity was normalized with the control. Results are the mean ± SD of triplicate samples from one representative experiment. ∗, p < 0.05 compared with controls. F, Intracellular staining of mBcl-2 in DN4 thymocytes from lck-tid1+/+ and lck-tid1f/f thymi. The intracellular mouse mBcl-2 was stained as described in Materials and Methods. The lck-tid1+/+ thymocytes stained with control Ab (□), lck-tid1f/f thymocytes stained with anti-mBcl-2 Ab (▦), and lck-tid1+/+ thymocytes stained with anti-mBcl-2 Ab (▪).
T cell-specific deletion of tid1 allows lck-tid1f/f thymocytes to undergo β-chain rearrangement, but affects the expression profile of genes involved in cytokine receptor signaling in DN4 T cells. Genomic DNA was isolated from sorted DN3 and DN4 thymocytes from lck-tid1+/+ and lck-tid1f/f mice. DNA was analyzed for the presence of TCRβ rearrangements using primers with specificity for Dβ-Jβ joints (A) or Vβ-DJβ joints (B). The Thy1 gene was used as an internal control for total DNA loading. C, Histograms of DN4 thymocytes from lck-tid1+/+ and lck-tid1f/f mice stained with TCRβ. Control mice (solid line) and mutant mice (gray-filled and dashed line) are shown. The negative control is indicated by a dotted line. RT and real-time PCR analyses of genes of interest were used to evaluate the gene expression patterns in DN3 (D) and DN4 (E) T cells derived from control, lck-tid1+/+, or lck-tid1f/f mice. Total RNA was isolated, and RT was performed to synthesize first-strand cDNA. Primer sets specific for tid1, CD3ε, pTα, IL-7R, Jak3, bcl-2, BAG1, and MEK7 were synthesized to assess expression profiles of these genes in DN3 or DN4 cells, as indicated. The housekeeping gene GAPDH was used as an internal control for DNA loading. The relative quantity was normalized with the control. Results are the mean ± SD of triplicate samples from one representative experiment. ∗, p < 0.05 compared with controls. F, Intracellular staining of mBcl-2 in DN4 thymocytes from lck-tid1+/+ and lck-tid1f/f thymi. The intracellular mouse mBcl-2 was stained as described in Materials and Methods. The lck-tid1+/+ thymocytes stained with control Ab (□), lck-tid1f/f thymocytes stained with anti-mBcl-2 Ab (▦), and lck-tid1+/+ thymocytes stained with anti-mBcl-2 Ab (▪).
Because the pre-TCR-CD3 complex mediates signals important for cell proliferation and for further DN cell differentiation, RT and real-time PCR were used to evaluate the expression profile of genes involved in formation of a pre-TCR-CD3 complex in DN3 and DN4 cells of control and mutant mice. The expression levels of CD3ε and pTα message appeared to be the same in control and mutant thymocytes (Fig. 4, D and E), and deletion of the tid1 gene was confirmed in lck-tid1f/f DN3 and DN4 T cells using tid1-specific PCR primers (Fig. 4, D and E). Cell surface expression of CD3ε on DN3 and DN4 T cells was also indistinguishable by FACS analysis between control and mutant thymocytes (data not shown). The normal β-chain rearrangement and pre-TCR signaling complex expression in lck-tid1f/f DN3 cells along with the enhanced cell death and decreased cell proliferation in lck-tid1f/f DN4 cells indicated that tid1 is critical in DN3-DP transition after β-chain rearrangement.
Tid1 deficiency disturbs gene expression profiles of components within cytokine signaling pathways
To identify the influence of molecular signaling in lck-tid1f/f DN3 and DN4 cells after deletion of tid1, RT and real-time PCR analyses were performed to screen for components within the IL-7 signaling pathway, such as IL-7, IL-7R, and the key downstream effectors, Jak3 and bcl-2, which are known to be involved in cell proliferation and cell survival for DN T cells (21, 22, 23, 24). Real-time PCR analysis showed that the expression levels of IL-7R and Jak3 were comparable in both control lck-tid1+/+ and mutant lck-tid1f/f DN3 cells (Fig. 4,D), although in mutant DN4 cells, the mRNA levels of IL-7R and Jak3 were noticeably reduced (Fig. 4,E). The IL-7 transcript was not detectable in any of the DN3 or DN4 T cells (data not shown), because it is known that epithelial cells of stromal tissue in thymus, not thymocytes, are the major source of IL-7 production (25). Of the genes examined, the bcl-2 message in mutant DN4 cells was the most significantly reduced to ∼20% of that in control DN4 cells (Fig. 4,E). FACS analysis of the intracellular mBcl-2 protein also showed significant down-regulation of mBcl-2 protein in lck-tid1f/f DN4 cells compared with that of control lck-tid1+/+ mice (Fig. 4,F). These data demonstrated that in mutant DN4 cells the expression of IL-7R, Jak3, and, most significantly, mbcl-2 was decreased due to the absence of tid1. Previously, we found that in Tid1-deleted mouse embryonic fibroblasts (MEF), the expressions of MEK7 and BAG1 genes were considerably reduced (12). However, these two genes were expressed at comparable levels in lck-tid1f/f and lck-tid1+/+ DN cells (Fig. 4, D and E).
Expression of a bcl-2 transgene restores T lymphocyte development in lck-tid1f/f mice
Because increased apoptosis in lck-tid1f/f DN4 cells coincided with the decreased expression of the antiapoptotic gene bcl-2, we wondered whether restoring expression of the bcl-2 gene could rescue the developmental defects observed in lck-tid1f/f mice. To examine this, lck-tid1f/f mice were crossed with Eu-bcl-2–36 transgenic mice, which express a hbcl-2 cDNA constitutively in T and B lymphoid cells (14). As shown in Fig. 5,A, almost all the thymocytes of hbcl-2/lck-tid1f/f mice stained positively with an Ab against hBcl-2, including DP, DN, DN3, and DN4 subpopulations, compared with that of lck-tid1f/+ mice (Fig. 5,A). The constitutive expression of hbcl-2 in hbcl-2/lck-tid1f/f T cells not only restored the thymic atrophy, but the thymocytes of these mice also displayed a similar distribution of the four major subsets, DP, DN, CD4 SP, and CD8 SP, as in the lck-tid1f/+ mice (Fig. 5, B and C). These results suggested that tid1 regulates DN transition to DP cells by controlling expression of the bcl-2 gene. RT and real-time PCR analysis showed that the expression of CD3ε in lck-tid1f/+, lck-tid1f/f, hbcl-2/lck-tid1f/+, and hbcl-2/lck-tid1f/f DN4 was comparable (Fig. 5,D). However, mBcl-2 expression in hbcl-2/lck-tid1f/f DN4 cells remained at levels similar to that in lck-tid1f/f DN4 cells. Our data suggested that although the expression of hBcl-2 rescued T cell development in lck-tid1f/f mice, enforced expression of hBcl-2 did not alter the expression level of IL-7R or mBcl-2 in mutant mice, indicating that the expression of hBcl-2 has no feedback mechanism to up-regulate IL-7R or mBcl-2 expression (Fig. 5 D).

Expression of human bcl-2 transgene restored T lymphocyte production and differentiation in lck-tid1f/f mice. A, The expression of transgenic hBcl-2 in total and subpopulations of thymocytes. Total and subpopulations of DP, DN, DN3, or DN4 thymocytes were determined by FACS analysis with CD4, CD8, CD25, and CD44 Ab staining. Intracellular hBcl-2 was stained as described in Materials and Methods. □, hbcl-2/lck-tid1f/f thymocyte stained with control Ab; ▦, lck-tid1f/+ thymocyte stained with anti-hBcl-2 Ab; ▪, hbcl-2/lck-tid1f/f thymocyte stained with anti-hBcl-2 Ab. B, Profile of thymocyte subsets was analyzed in lck-tid1f/+, lck-tid1f/f, and hbcl-2/lck-tid1f/f mice by immunofluorescence staining and flow cytometric analysis with CD4 and CD8 Abs. Numbers in quadrants indicate the percentages of cells in these areas. C, Thymocyte cell counts were performed on single-cell suspensions prepared from thymi of lck-tid1f/+ mice (□), lck-tid1f/f mice (▪), and hbcl-2/lck-tid1f/f mice (▦). The numbers of DN, DP, CD4 SP, and CD8 SP T cells in the thymus were calculated by determining their frequency by flow cytometric analysis and multiplication by the number of total thymocytes. The data represent the mean ± SD of three mice of each genotype. ∗, p < 0.05, by paired t test compared on each thymocyte population of fluorescence intensity. D, Real-time RT-PCR analysis of genes of interest was used to evaluate the gene expression patterns in DN4 T cells derived from lck-tid1f/+ (□), lck-tid1f/f (▪), hbcl-2-lck-tid1f/+ (▨), or hbcl-2-lck-tid1f/f (▦) mice. Total RNA was isolated, and RT was performed to synthesize first-strand cDNA. Primer sets specific for CD3ε, IL-7R, and mbcl-2 were used to assess expression profiles of these genes in DN4 cells. The housekeeping gene GAPDH was used as an internal control for DNA loading. The relative quantity was normalized with lck-tid1f/+. Results are the mean ± SD of triplicate samples from one representative experiment. ∗, p < 0.05 compared with controls.
Expression of human bcl-2 transgene restored T lymphocyte production and differentiation in lck-tid1f/f mice. A, The expression of transgenic hBcl-2 in total and subpopulations of thymocytes. Total and subpopulations of DP, DN, DN3, or DN4 thymocytes were determined by FACS analysis with CD4, CD8, CD25, and CD44 Ab staining. Intracellular hBcl-2 was stained as described in Materials and Methods. □, hbcl-2/lck-tid1f/f thymocyte stained with control Ab; ▦, lck-tid1f/+ thymocyte stained with anti-hBcl-2 Ab; ▪, hbcl-2/lck-tid1f/f thymocyte stained with anti-hBcl-2 Ab. B, Profile of thymocyte subsets was analyzed in lck-tid1f/+, lck-tid1f/f, and hbcl-2/lck-tid1f/f mice by immunofluorescence staining and flow cytometric analysis with CD4 and CD8 Abs. Numbers in quadrants indicate the percentages of cells in these areas. C, Thymocyte cell counts were performed on single-cell suspensions prepared from thymi of lck-tid1f/+ mice (□), lck-tid1f/f mice (▪), and hbcl-2/lck-tid1f/f mice (▦). The numbers of DN, DP, CD4 SP, and CD8 SP T cells in the thymus were calculated by determining their frequency by flow cytometric analysis and multiplication by the number of total thymocytes. The data represent the mean ± SD of three mice of each genotype. ∗, p < 0.05, by paired t test compared on each thymocyte population of fluorescence intensity. D, Real-time RT-PCR analysis of genes of interest was used to evaluate the gene expression patterns in DN4 T cells derived from lck-tid1f/+ (□), lck-tid1f/f (▪), hbcl-2-lck-tid1f/+ (▨), or hbcl-2-lck-tid1f/f (▦) mice. Total RNA was isolated, and RT was performed to synthesize first-strand cDNA. Primer sets specific for CD3ε, IL-7R, and mbcl-2 were used to assess expression profiles of these genes in DN4 cells. The housekeeping gene GAPDH was used as an internal control for DNA loading. The relative quantity was normalized with lck-tid1f/+. Results are the mean ± SD of triplicate samples from one representative experiment. ∗, p < 0.05 compared with controls.
Discussion
With the observation that DN3 T cells from lck-tid1f/f mice underwent β-chain rearrangement and were able to differentiate into DN4 cells, but additional development from DN to DP was impaired, we speculated that deletion of tid1 damaged the proper pre-TCR and/or cytokine receptor signaling by which DN cells could continue subsequent T cell lineage development. It is noteworthy that deletion of tid1 in lck-tid1f/f DN4 cells causes down-regulation of components, including IL-7R, Jak3, and, most significantly, bcl-2, in the IL-7 signaling pathway, which provides cell survival signals in DN cells (25). Interestingly, both IL-7R−/− (26) and lck-tid1f/f mice showed defective T lymphocyte development. The majority of thymocytes in both IL-7R−/− and lck-tid1f/f thymi are DN cells exhibiting successful β-chain rearrangement (27). IL-7R−/− mice completely lack γδ T cell development due to aberrant γ-chain rearrangement in IL-7R−/− thymocytes (27). However, in lck-tid1f/f mice, the deletion of tid1 in T cells did not affect γδ T cell development (Fig. 2,C). Transgenic expression of bcl-2 can restore αβ T lymphocyte development in both IL-7R-deficient and Tid1-deficient mice (Refs.28 and 29 and this study), but cannot rescue the γδ T cell in IL-7R−/− mice, because the γ-chain rearrangement is not completed (27). Bcl-2, an antiapoptotic molecule, is expressed at the DN and SP stages of thymocytes, but not in most DP cells (30, 31). The study by von Freeden-Jeffry et al. (20) showed that bcl-2 expression is dependent on IL-7 when cells become committed to the T cell lineage at the DN stage. It is possible that Tid1 deletion reduces the expression of IL-7R and its downstream effectors in DN cells, leading to defective αβ T lymphocyte development in the thymus of lck-tid1f/f mice. However, γδ T cell development in lck-tid1f/f mice is not impaired as in IL-7R−/− mice. This discrepancy may be due to the total absence of IL-7R in IL-7R knockout mice, although in Tid1-deficient mice, the expression of IL-7R is only partially reduced, but may still transmit enough signal for γδ T cell development. Other than impairment of IL-7 cytokine signaling, the presence of high TCRβ in mutant DN4 thymocytes suggests that without tid1, this unusual mature DN4 cells could be a specific feature of abnormal T cell development in lck-tid1f/f mice, and these mutant DN4 cells may not be the progenitors for DP thymocytes (Fig. 4 C).
Lck (32) is a protein tyrosine kinase involved in T cell development. Lck is expressed exclusively in lymphoid cells, predominantly in thymocytes and peripheral T cells, associates specifically with the cytoplasmic domains of both CD4 and CD8 T cell surface glycoproteins, and interacts with the β-chain of the IL-2R, which implicates Lck activity in signal transduction during thymocyte ontogeny and activation of mature T cells. The expression of lck in DN3 and DN4 cells, however, did not differ significantly between control and mutant mice. It has been reported that both Lck and Tid1 can interact with Ras GTPase-activating protein (RasGAP) (33, 34). Down-regulation of Ras activity is attributed to the function of cytosolic RasGAP (35). RasGAP stimulates the weak intrinsic GTPase activity of Ras, accelerating the hydrolysis of bound GTP to GDP, thereby terminating mitogenic signals elicited by Ras protein. Even though the expression of lck in DN3 and DN4 lck-tid1f/f thymocytes did not differ from that in control thymocytes, it is possible that without tid1, the extent of RasGAP down-regulation is affected and eventually perturbs the signaling in DN4 cells, resulting in increased apoptosis and reduced proliferation of these cells. This is currently under investigation.
In MEF lacking tid1, we demonstrated that the reduction of BAG1 and MEK7 transcripts led to the death of these cells (12). However, no change in the expression of these two genes was observed in mutant DN3 or DN4 thymocytes (Fig. 4, D and E). In contrast, the expression level of the bcl-2 gene is not altered in Tid1-deleted MEF, and ectopic expression of Bcl-2 in these Tid1-deficient MEFs did not deter the death of these cells (data not shown). These results indicate that the molecular mechanism of Tid1-mediated survival signal in MEFs is different from that in DN4 T cells during T cell development.
In lck-tid1f/f mice, we also found that peripheral T cell numbers were greatly reduced, and their response to a T cell agonist was greatly attenuated (data not shown). At this time, we do not know whether these defects in peripheral T cells are due to the loss of function of tid1 during the DN stage or at later stages. We are currently mating tid1-floxed mice with CD4-Cre mice (13) to generate mice with tid1 specifically deleted in T cells during the DP phase to investigate whether tid1 has an additional role in T cell development after the DN phase.
In summary, our data suggested that tid1 is critical for the transition of DN cells to DP cells in early T cell development through modulating the expression of antiapoptotic bcl-2.
Acknowledgments
We thank Drs. Nicholas Gascoigne and Jonathan Kaye for their helpful comments during the preparation of this manuscript.
Disclosures
The authors have no financial conflict of interest.
Footnotes
The costs of publication of this article were defrayed in part by the payment of page charges. This article must therefore be hereby marked advertisement in accordance with 18 U.S.C. Section 1734 solely to indicate this fact.
This work was supported by funds from National Cancer Institute (CA079871) and the Department of Defense Breast Cancer Research Program (BC031105).
Abbreviations used in this paper: DN, double negative; 7-AAD, 7-aminoactinomycin; DP, double positive; h, human; Lin, lineage marker; m, mouse; MEF, mouse embryonic fibroblast; PI, propidium iodide; RasGAP, Ras GTPase-activating protein; SP, single positive.
