

Abstract
The size of the thymus can be greatly influenced by changes in the small number of early progenitors in the thymus. However, it is not known whether thymic cellularity feeds back to regulate the recruitment, survival, and expansion of progenitors. The transcription factor early growth response gene 1 (Egr1) has been implicated in controlling proliferation and survival in many cell types. We have previously shown that mice deficient in Egr1 have increased thymic cellularity. We now show that Egr1 regulates a negative feedback signal that controls the entry of cells into the thymus. Egr1-deficient mice have higher percentages of early T lineage progenitors in the thymus, yet Egr1-deficient mice have normal numbers of myelolymphoid progenitors in the bone marrow, and Egr1-deficient thymocytes show normal rates of apoptosis and proliferation at all stages of development. Evidence from mixed bone marrow chimeras shows that the ability of Egr1 to control progenitor recruitment is mediated by bone marrow-derived cells, but is not cell autonomous. Furthermore, Egr1-deficient thymuses have increased P-selectin expression. The data suggest that Egr1 mediates a feedback mechanism whereby the number of resident double negative thymocytes controls the entry of new progenitors into the thymus by regulating P-selectin expression on thymic endothelial cells.
Although a fairly fundamental aspect of biology, the mechanisms that control organ size remain largely unknown (1). The basic tenants that control organ size are the number of cells and the size of the cells in an organ. Thus, the growth, proliferation, death, and entry and exit of cells from an organ must all be regulated to maintain appropriate size. In addition, there must also be mechanisms that determine which size is appropriate. The thymus is a unique model system to study the regulation of organ size because the thymus does not have any self-renewing progenitors. Instead, the thymus relies on continuous input of a small number of progenitor cells from the bone marrow (BM).3 Once in the thymus, these progenitors undergo a large expansion, although very few of these cells ever exit the thymus. Most thymocytes die during the stringent selection process in the thymus. Therefore, the homeostatic size of the thymus is controlled mainly by entry of progenitors into the thymus, intrathymic expansion of these cells, and apoptosis of self-reactive clones.
The release of progenitors into the blood from the BM and the entry of these progenitors into the thymus is a coordinated process in which the thymus goes through refractory and responsive periods (2, 3). Hence, a wave of progenitors is released from the BM about 1 wk before the thymus becomes responsive to progenitor entry (2). This suggests that the thymus may be able to feed back both to progenitors in the BM, and to the thymic stroma at the site of progenitor entry. The mechanism by which the thymus may regulate release of progenitors into the blood and the entry of progenitors into the thymus is currently unknown. Progenitor entry into the thymus occurs at the junction between the cortical and medullary regions (4). Once in the thymus, the early T lineage progenitors (ETP, defined as lineage (Lin)low, CD117high, CD44+, CD25−) spend ∼10 days near the site of entry where they receive signals for survival, proliferation, and T lineage commitment (5). After the initial 10-day period at the thymic entry site, ETP up-regulate CD25 to become double negative (DN) stage 2 (DN2) thymocytes (CD44+, CD25+), at which point they begin to proliferate and migrate toward the outer cortex (6). At the outer cortex, thymocyte progenitors transition to the next stage of development, the DN3 stage (CD44−, CD25+), where selection for cells with successful TCR-β rearrangement occurs. The cells that make it through the β-selection step represent the pre-double positive (DP) stage of development, or the DN4 stage (CD44−, CD25−). DN4 thymocytes undergo multiple rounds of proliferation and migrate back toward the inner cortex while up-regulating CD4 and CD8 molecules to become DP cells that are ready for positive and negative selection.
The bulk of the thymus cellularity is made up of DP thymocytes, whereas only ∼2–5% of the thymus is made up of CD4/CD8 DN progenitors. This means that each precursor that enters the thymus has an enormous amount of expansion potential, with each progenitor able to give rise to ∼1 million progeny (7). Roughly half of the expansion of thymocytes occurs at the transition between DN and DP stage, and this expansion seems to be intrinsically regulated and independent of thymus size (8). Most remaining intrathymic expansion occurs during the DN stages of development. Prockop et al. (8) demonstrated that the number of DN2/DN3 cells prevents the expansion of new intrathymic progenitors presumably due to limiting numbers of stromal cell niches. Thus, once progenitor cells enter the thymus, their expansion is regulated by competition for niches, and appears to be independent of progenitor availability in the BM or the blood. In addition to regulation of intrathymic expansion, control of progenitor entry into the thymus may be a major point of regulation for thymus size. It has recently been demonstrated that progenitor entry into the thymus depends on P-selectin expression on the thymic endothelial cells, but how this is regulated has not been determined (9).
Early growth response gene 1 (Egr1) is a transcriptional regulator with a zinc finger DNA binding domain that is strongly stimulated by activation of ERK in many different cell types (10). Egr1 has been shown to play a role in growth control, transformation, and apoptosis in different cell types (11). In the thymus, Egr1 has been shown to regulate positive selection of DP thymocytes, but not to effect negative selection (12). Egr1 is also expressed during DN thymocyte development (13), and it is therefore possible that Egr1 regulates the early stages of thymocyte development. In this study, we show a novel role for Egr1 in the regulation of progenitor entry into the thymus. Egr1-deficient mice have increased thymic cellularity, and this phenotype is due to loss of Egr1 expression in hemopoietic cells. The increased cellularity in Egr1-deficient thymuses is due to increased frequencies of ETP. However, it appears that Egr1 does not regulate the proliferation or survival of ETP in a cell autonomous manner, but instead Egr1 controls a feedback signal that allows DN thymocytes to regulate the recruitment of progenitors into the thymus by influencing the expression of P-selectin by the thymic endothelium.
Materials and Methods
Mice
Egr1-deficient mice were generated as described and backcrossed to the C57BL/6 background over seven generations (14). The targeted allele was then crossed two generations to B6.AKR and screened for the H-2k/k genotype to generate Egr1-deficient mice on the B6.AKR background. B6.PL mice were bred onto the B6.AKR background and were screened for the Thy1.1 genotype. B6.AKR and B6.PL mice were purchased from The Jackson Laboratory. All procedures were approved by the Emory University Institutional Animal Care and Use Committee.
Flow cytometry
The following Abs used in this study were purchased from BD Biosciences: CD19-FITC, CD90.1-FITC, CD44-PE/Cy5, CD4-PE (clone GK1.5), CD24-FITC, anti-BrdU-FITC. The following reagents were purchased from Caltag Laboratories: CD25-PE, CD11b-FITC, B220-FITC, CD8a-TriColor, Annexin VFITC, and streptavidin-TriColor. The following reagents were purchased from eBioscience: Gr1-FITC (clone RB6-8C5), CD4-FITC (clone GK1.5), CD8a-FITC, Ter-119-FITC, CD3e-FITC (clone 2C11), CD117-allophycocyanin (clone 2B8), CD90.2-allophycocyanin (clone 53-2.1), and CD135-biotin (clone AF210). ScaI-PE was purchased from Leinco Technologies. Abs used to exclude Lin+ cells were FITC-conjugated anti-B220, anti-CD11b, anti-Gr-1, anti-Ter-119, anti-CD3, anti-CD4, and anti-CD8. Thymocyte apoptosis was analyzed using the Annexin VFITC apoptosis detection kit I (BD Biosciences) according to manufacturer’s instructions. Samples were run on a FACSCalibur (BD Biosciences) and data analyzed using FlowJo software (Tree Star).
BM chimera
Either B6.AKR, B6.AKR.PL, or Egr1−/− mice were lethally irradiated (2 × 600 rad, 4 h apart) and i.v. injected with between 2.5 and 5 × 10⁶ BM cells harvested from either Egr1+/+ or Egr1−/− mice. For mixed BM chimeras, BM from Egr1+/+ and Egr1−/− mice were counted and mixed in a 1:1 ratio and i.v. injected into lethally irradiated hosts. Thymuses were harvested between 3 and 7 wk post-BM reconstitution. Host hemopoietic cells comprised <2% of total thymus cellularity.
BrdU labeling
BrdU incorporation was detected with the BrdU flow kit (BD Biosciences). For short-term pulse, 1 mg of BrdU was injected i.p. and mice were sacrificed 5 h later. Thymuses were harvested, and single-cell suspensions were produced followed by fixation in Cytofix/Cytoperm buffer. Cells were then treated with DNase to expose BrdU epitopes, then immunofluorescent staining was performed with anti-BrdU FITC.
Quantitative real-time RT-PCR
Total RNA was extracted from thymi of mice using TRIzol reagent (Invitrogen Life Technologies) according to manufacturer’s instructions and homogenized. Reverse transcription was completed with 2 μg of total RNA using 200 U of Superscript II Reverse Transcriptase (Invitrogen Life Technologies) and 3 μg of random primers (Invitrogen Life Technologies) in a 20 μl volume. Primer sequences for P-selectin (15) and vascular endothelial (VE)-cadherin (9) were previously described. Real-time reactions were performed in 50-μl reactions prepared using Platinum SYBR Green Quantitative PCR SuperMix UDG (Invitrogen Life Technologies). A master mix was made using 25 μl of SYBR Green Supermix, 2.5 μl each of forward and reverse primers (5 μM stock), and autoclaved distilled water to 40 μl. Template was added using 0.5 μl of cDNA diluted in 9.5 μl of autoclaved distilled water. All samples were prepared as triplicates; no-template controls were included to check for primer-dimers and external contamination. The following program was used: 2 min hold at 50°C, 10 min denaturation at 95°C, then 40 cycles of real-time PCR was conducted consisting of 15 s at 95°C followed by 60 s at 60°C. To verify the specificity of amplification, a melting curve was performed starting at 60°C with a rate of 0.5°C per 10 s up to 95°C with continuous measurement of fluorescence. PCR efficiency was determined by calculating the slope of a standard curve for both P-selectin and VE-cadherin. Data analysis was conducted with a relative quantification software tool (REST) using VE-cadherin as an internal reference control.
In vitro cultures of thymic progenitor cells
For culture of thymic progenitor cells in vitro, layers of OP9-Delta-like 1 (OP9-DL1) stromal cells provided by J. C. Zúñiga-Pflücker (University of Toronto, Toronto, Ontario, Canada) were plated in 24-well plates 24 h before progenitors were added. BM was prepared and 1 × 10⁶ cells per well were added onto OP9-DL1 monolayers in RPMI 1640 medium containing 10% FCS supplemented with l-glutamine, 2-ME, gentamicin, 5 ng/ml of both rIL-7 and fms-like tyrosine (Flt) kinase 3 ligand (PeproTech).
Immunofluorescent microscopy
Frozen sections of 6- to 10-μm thickness were cut and air dried for 60 min, fixed in acetone for 10 min at −20°C and air dried again for 20 min. Sections were washed in PBS five times and 0.3% hydrogen peroxide in PBS was overlaid for 30 min at 37°C. The sections were washed three times in PBS and TSA (Tyramide Signal Amplification; PerkinElmer) blocking buffer was overlaid for 30 min at room temperature. CD117 Ab (clone ACK-2; eBioscience) was diluted in TSA blocking buffer and added for 60 min at room temperature. Biotinylated polyclonal goat anti-rat IgG diluted in TSA buffer was then overlaid after washing and incubated at room temperature for 30 min. Sections were washed in PBS and streptavidin-HRP diluted in TSA buffer was then added for 30 min at room temperature. Sections were washed with PBS and FITC-tyramide was diluted in TSA buffer and placed on the sections for 10 min at room temperature. Slides were washed with PBS, and ToPro-3 diluted in TSA buffer was added for 15 min. Slides were mounted using ProLong Gold antifade medium (Molecular Probes).
Statistics
Data are expressed as mean ± SE. Differences between groups were determined by Student’s t test using GraphPad Prism software and were considered statistically significant at values for p < 0.05. Linear and nonlinear regression analysis was determined using best-fit linear and exponential curves from GraphPad Prism.
Results
Egr1-deficient mice have enlarged thymuses
Analysis of thymuses from Egr1-deficient mice revealed a dramatic increase in total thymic cellularity compared with age-matched wild-type controls (Fig. 1,A). Egr1-deficient mice that are 9 wk of age or younger had a greater than 2-fold increase in the number of thymocytes compared with age-matched controls (Fig. 1,A). However, this phenotype became less severe in older mice; 10- to 15-wk-old thymuses from Egr1−/− mice dropped to an average of 198 ± 16 × 106 cells, whereas Egr1+/+ thymus cellularity did not decline (127 ± 10 × 106 cells). The increase in thymus cellularity in Egr1-deficient mice became statistically insignificant once mice were beyond 15 wk of age (Fig. 1 A).
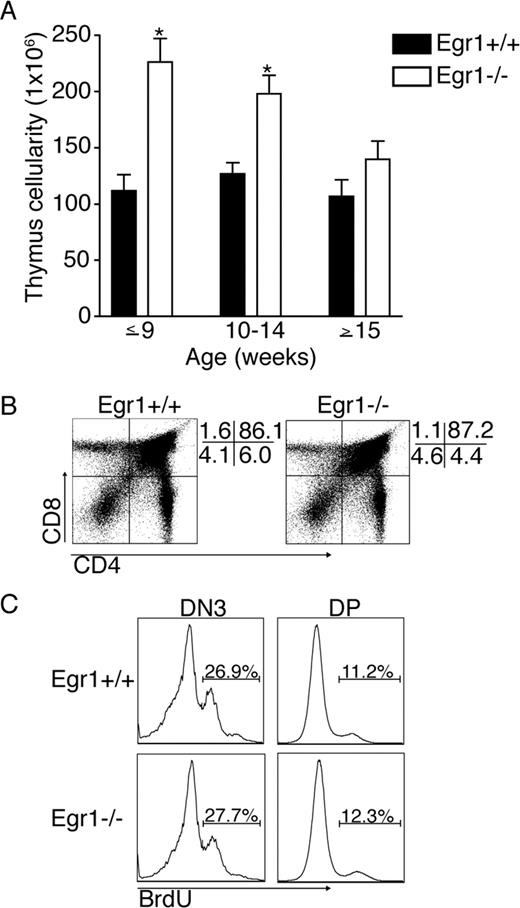
Egr1-deficient mice have increased thymic cellularity and normal distribution and proliferation at the DN3 and DP stages of development. Cell suspensions were prepared from thymuses of age-matched Egr1+/+ and Egr1−/− mice and counted. A, Graphs display total numbers of thymocytes according to age groupings for Egr1+/+ and Egr1−/− mice. Data represent between 10 and 22 mice/group ± SE. ∗, p < 0.001. B, Thymocytes from 8-wk-old Egr1+/+ (left) and Egr1−/− (right) mice were stained for CD4 and CD8 to assess thymocyte distribution. At the right side of both dot plots, the percentage of gated cells that fall into each quadrant is given. C, Egr1+/+ (top) and Egr1−/− (bottom) mice were injected i.p. with 1 mg of BrdU and sacrificed 5 h later. Thymocytes were harvested and stained for BrdU incorporation of DN3 (left) and DP (right) cells. The percentage of cells (inset) is indicated for each gated region.
Egr1-deficient mice have increased thymic cellularity and normal distribution and proliferation at the DN3 and DP stages of development. Cell suspensions were prepared from thymuses of age-matched Egr1+/+ and Egr1−/− mice and counted. A, Graphs display total numbers of thymocytes according to age groupings for Egr1+/+ and Egr1−/− mice. Data represent between 10 and 22 mice/group ± SE. ∗, p < 0.001. B, Thymocytes from 8-wk-old Egr1+/+ (left) and Egr1−/− (right) mice were stained for CD4 and CD8 to assess thymocyte distribution. At the right side of both dot plots, the percentage of gated cells that fall into each quadrant is given. C, Egr1+/+ (top) and Egr1−/− (bottom) mice were injected i.p. with 1 mg of BrdU and sacrificed 5 h later. Thymocytes were harvested and stained for BrdU incorporation of DN3 (left) and DP (right) cells. The percentage of cells (inset) is indicated for each gated region.
The majority of thymocytes are CD4/CD8 DP cells. These cells are abundant due to the large amount of cell division that takes place as cells transition from DN to DP. The larger thymuses in Egr1-deficient mice could be the result of enhanced proliferation at this transition. However, the overall distribution of thymocytes was normal in Egr1-deficient mice (Fig. 1,B). CD4/CD8 DP cells from an Egr1+/+ mouse comprised 86.1% of the thymus, whereas an Egr1−/− thymus contained 87.2% DP cells. In addition, we examined proliferation of thymocytes in the transition from DN to DP by conducting a short-term BrdU pulse where we harvested thymuses 5 h after injection of BrdU to assay for BrdU incorporation. As can be seen in Fig. 1 C, Egr1−/− mice showed normal rates of proliferation at the late DN stage (DN3) and the DP stage of development.
Increased thymus cellularity in Egr1-deficient mice is intrinsic to hemopoietic cells
The increase in thymus cellularity observed in Egr1−/− mice could be due to alterations in thymocytes, thymic stromal cells, or in cells outside of the thymus. We therefore sought to better define the cell type responsible for the increased cellularity in Egr1-deficient mice. We produced BM chimeric mice by injecting either Egr1+/+ or Egr1−/− BM into lethally irradiated Egr1+/+ or Egr1−/− hosts. As can be seen in Fig. 2, transfer of Egr1−/− BM to either Egr1+/+ or Egr1−/− hosts conferred hosts with large thymuses. In addition, Egr1−/− host thymuses revert back to wild-type sizes with the transfer of Egr1+/+ BM (Fig. 2). Thus, the genotype of the BM correlated with the cellularity of the reconstituted thymus. These results show that loss of Egr1 in hemopoietic cells results in an increase in thymus cellularity.

Increased cellularity of Egr1-deficient thymuses is due to the loss of Egr1 in hemopoietic cells. BM from Egr1+/+ or Egr1−/− mice (2.5 × 10⁶ cells) was i.v. injected into lethally irradiated Egr1+/+ or Egr1−/− mice. Thymuses were harvested 6 wk post-BM reconstitution, and cellularity was assessed. Data represent between three and nine mice per group ± SE. ∗∗, p < 0.0025; ∗, p < 0.05.
Increased cellularity of Egr1-deficient thymuses is due to the loss of Egr1 in hemopoietic cells. BM from Egr1+/+ or Egr1−/− mice (2.5 × 10⁶ cells) was i.v. injected into lethally irradiated Egr1+/+ or Egr1−/− mice. Thymuses were harvested 6 wk post-BM reconstitution, and cellularity was assessed. Data represent between three and nine mice per group ± SE. ∗∗, p < 0.0025; ∗, p < 0.05.
Normal frequency and number of myelolymphoid progenitors in BM of Egr1-deficient mice
It is possible that the loss of Egr1 results in higher frequencies of myelolymphoid progenitors in the BM. Increased numbers of myelolymphoid progenitors could result in increased thymus sizes because more progenitors are available for trafficking to the thymus. It has recently been demonstrated that T cell progenitor activity is contained in an LSK (Lin−, Sca-1high, CD117+) cell subset that can be found in both the BM and the blood (16, 17). We found the frequency of LSK cells in Egr1−/− BM to be 1.12 ± 0.09 per 103 cells, whereas the frequency of LSK in Egr1+/+ mice was 1.19 ± 0.13 per 103 cells. The LSK population is heterogeneous, so to further characterize the T cell progenitors in Egr1-deficient BM, we analyzed the Flt3+ subset of LSK. Expression of Flt3 is seen only on nonrenewing hemopoietic stem cells, suggesting that these Flt3 expressing LSK cells are a further differentiated population (18). Gating on the LSK Flt3+ cells, we observed no difference in the frequency between Egr1+/+ and Egr1−/− mice (Fig. 3 B). The BM yields from Egr1+/+ and Egr1−/− mice were also similar, suggesting that Egr1-deficient mice have normal numbers of myelolymphoid progenitors.

Normal numbers of myelolymphoid progenitors in BM of Egr1-deficient mice. A, BM was harvested from Egr1+/+ or Egr1−/− mice and stained for CD117, Sca-1, and Flt3 on Lin− cells to identify LSK Flt3+ cells. The percentage of cells (inset) represents each gated region. B, The frequency of LSK and LSK Flt3+ cells in BM as determined by flow cytometry. Data are an average of 11 mice/group ± SE.
Normal numbers of myelolymphoid progenitors in BM of Egr1-deficient mice. A, BM was harvested from Egr1+/+ or Egr1−/− mice and stained for CD117, Sca-1, and Flt3 on Lin− cells to identify LSK Flt3+ cells. The percentage of cells (inset) represents each gated region. B, The frequency of LSK and LSK Flt3+ cells in BM as determined by flow cytometry. Data are an average of 11 mice/group ± SE.
Increased percentages of ETP in Egr1-deficient thymuses
We next examined the earliest stages of thymocyte development to determine whether the loss of Egr1 increased the number of early thymocytes. Linlow thymocytes from Egr1+/+ and Egr1−/− mice were subdivided into four DN subsets based on CD44 and CD25 staining (7). The DN1 subset (CD44+, CD25−) has been shown to be a heterogeneous population, and cells with true T lineage potential are the ETP (Linlow, CD44+, CD25−, CD117+) (16, 19, 20). As shown in Fig. 4,A, examination of CD117 expression among the DN1 population revealed that Egr1−/− mice have a higher percentage of CD117+ cells (18 vs 35% for Egr1+/+ vs Egr1−/− mice, respectively). ETP make up an average of 0.034 ± 0.004% of the total thymus in Egr1−/− mice, whereas Egr1+/+ mice average 0.013 ± 0.002% ETP (Fig. 4,B). We also assessed the frequency of thymocyte progenitors by examining CD24 and CD117 expression on DN1 thymocytes. DN1 cells can be divided into five different populations based on expression of CD24 and CD117, with the earliest progenitors being CD24low and CD117high (DN1a) (6). Using these criteria, we found that Egr1-deficient mice possessed increased frequencies of DN1a cells (Fig. 4,D), again suggesting that the earliest thymocyte progenitor population is expanded in Egr1-deficient mice. Examination of the DN2 subset revealed much the same phenotype, with Egr1−/− mice also having increased percentages of DN2 thymocytes (Fig. 4, A and B). However, Egr1-deficient mice have normal percentages of DN3 and DN4 cells (Fig. 4, A and B). In accordance with the enlarged thymuses and increased frequency of ETP and DN2 thymocytes in Egr1-deficient mice, we found that Egr1−/− mice also had a 6-fold increase in both ETP and DN2 thymocyte numbers (Fig. 4,C). Although Egr1−/− mice have normal percentages of DN3 and DN4 thymocytes, they have increased numbers of cells at these stages because of the increase in numbers of ETP and DN2 cells (Fig. 4 C).

Egr1-deficient mice have increased percentages of ETP. Cell suspensions were prepared from thymuses of 8- or 10-wk-old Egr1+/+ or Egr1−/− mice and stained for CD25, CD44, and CD117, and lineage markers. A, The contour plots show Lineagelow cells divided into four subsets by CD25 and CD44 staining. At the right of each contour plot, the percentage of gated cells that fall into each quadrant is given. Histograms represent CD117 expression among DN1 (left) and DN2 (right) cells. Values (inset) in the plots are the frequency of cells lying within the indicated regions. Frequency (B) and absolute number (C) of ETP, DN2, DN3, and DN4 cells in Egr1+/+ and Egr1−/− mouse thymuses. ∗∗∗, p < 0.001; ∗∗, p < 0.01; ∗, p < 0.05. D, Cell suspensions were prepared from thymuses of 8-wk-old Egr1+/+ or Egr1−/− mice and CD4/CD8 DP cells were bead depleted leaving DN cells. DN cells were stained for CD24, CD44, c-kit, and lineage markers (including CD25). The plots show CD24 and CD117 staining among Linlow DN1 cells. Values to the right of the gated region indicate the frequency of cells among DN1 cells. E, The data show BrdU labeling of ETP from Egr1+/+ and Egr1−/− mice given an i.p. injection of 1 mg of BrdU and sacrificed 5 h later. F, ETP from age-matched Egr1+/+ and Egr1−/− mice were stained directly ex vivo for annexin V. Data are an average of three to seven mice per group ± SE.
Egr1-deficient mice have increased percentages of ETP. Cell suspensions were prepared from thymuses of 8- or 10-wk-old Egr1+/+ or Egr1−/− mice and stained for CD25, CD44, and CD117, and lineage markers. A, The contour plots show Lineagelow cells divided into four subsets by CD25 and CD44 staining. At the right of each contour plot, the percentage of gated cells that fall into each quadrant is given. Histograms represent CD117 expression among DN1 (left) and DN2 (right) cells. Values (inset) in the plots are the frequency of cells lying within the indicated regions. Frequency (B) and absolute number (C) of ETP, DN2, DN3, and DN4 cells in Egr1+/+ and Egr1−/− mouse thymuses. ∗∗∗, p < 0.001; ∗∗, p < 0.01; ∗, p < 0.05. D, Cell suspensions were prepared from thymuses of 8-wk-old Egr1+/+ or Egr1−/− mice and CD4/CD8 DP cells were bead depleted leaving DN cells. DN cells were stained for CD24, CD44, c-kit, and lineage markers (including CD25). The plots show CD24 and CD117 staining among Linlow DN1 cells. Values to the right of the gated region indicate the frequency of cells among DN1 cells. E, The data show BrdU labeling of ETP from Egr1+/+ and Egr1−/− mice given an i.p. injection of 1 mg of BrdU and sacrificed 5 h later. F, ETP from age-matched Egr1+/+ and Egr1−/− mice were stained directly ex vivo for annexin V. Data are an average of three to seven mice per group ± SE.
The increased number of ETP in Egr1-deficient thymuses seems to account for the greater number of thymocytes at all of the subsequent stages of development. Increased rates of proliferation or aberrant survival could explain the increased percentages of ETP and DN2 cells seen in Egr1-deficient mice. We first examined the in vivo proliferation rates of Egr1-deficient ETP by conducting a short-term BrdU pulse. Egr1+/+ and Egr1−/− mice were pulsed with BrdU and thymuses were harvested 5 h later to assess BrdU incorporation. As shown in Fig. 4,E, ETP from Egr1+/+ and Egr1−/− mice proliferate at comparable rates. Similarly, BrdU incorporation was comparable for DN2 cells derived from Egr1+/+ and Egr1−/− mice (data not shown). Furthermore, we assessed the cell cycle status of all DN subsets and DP thymocytes using 7-aminoactinomycin D and again found no difference between Egr1+/+ and Egr1−/− mice (data not shown). To evaluate the survival of ETP, we calculated the percentage of apoptotic thymocyte progenitors directly ex vivo. As can be seen in Fig. 4 F, Egr1-deficient ETP show similar rates of apoptosis as ETP from wild-type mice. We also analyzed all other stages of thymocyte development, and again found no difference in the percentage of apoptotic cells between Egr1+/+ and Egr1−/− thymocytes (data not shown).
Egr1 controls thymus cellularity in a cell nonautonomous manner
Our data suggest that Egr1−/− thymocytes have normal rates of proliferation and apoptosis, yet loss of Egr1 leads to increased numbers of ETP. The simplest explanation for this result is that more progenitor cells are able to enter the thymus from the blood in Egr1−/− mice. However, it is still possible that Egr1-deficient thymocytes are intrinsically better able to expand immediately upon entry into the thymus, and we have not detected this because it only happens in the most immature cell type that has just entered the thymus. Such a cell is expected to be a subset of ETP, but has so far eluded definition (21). To distinguish between these possibilities, we setup competitive BM chimeras to determine whether the increased thymus cellularity seen in Egr1-deficient mice is cell autonomous. Egr1+/+ (CD90.1) and Egr1−/− (CD90.2) BM were mixed in a 1:1 ratio and injected into lethally irradiated Egr1+/+ hosts. As can be seen in Fig. 5,A, injecting a 1:1 mixture of Egr1+/+ and Egr1−/− BM conferred wild-type hosts with an intermediate size thymus in between hosts that received only Egr1+/+ (CD90.1) BM and hosts that received only Egr1−/− (CD90.2) BM. If the enlargement of Egr1-deficient thymuses is due to an intrinsic ability of Egr1−/− progenitors to expand, then the percentage of Egr1−/− thymocytes in the mixed BM chimeras should be >50%. However, if the increased thymus cellularity in Egr1-deficient mice is a cell nonautonomous phenotype, then a 1:1 ratio of Egr1+/+ and Egr1−/− thymocytes should be maintained. Indeed, as can be seen in Fig. 5,B, a 1:1 ratio is maintained in the thymuses of mice that received a 1:1 mixture of Egr1+/+ and Egr1−/− BM. Thymocyte distribution was normal among all subsets that were analyzed in BM chimeric mice (data not shown). To rule out any competitive advantage between the CD90 isoforms, we mixed BM from the two isoforms, both on the Egr1+/+ background, and injected it into lethally irradiated hosts. These hosts had normal thymus cellularity and the 1:1 ratio of CD90 isoforms was maintained in the thymuses of these mice (Fig. 5). These results show that the presence of Egr1−/− BM results in increased numbers of both Egr1−/− and Egr1+/+ thymocytes, and suggest that the intrinsic abilities of Egr1−/− and Egr1+/+ progenitors to populate the thymus are similar. The data are consistent with the regulation of progenitor entry into the thymus being controlled by an Egr1-mediated signal emanating from hemopoietic cells.

Egr1 regulates thymic cellularity in a cell nonautonomous manner. Lethally irradiated wild-type hosts were injected with Egr1+/+ (CD90.1) or Egr1−/− (CD90.2) BM or a 1:1 mixture of Egr1+/+ (CD90.1) BM and either Egr1−/− (CD90.2) or Egr1+/+ (CD90.2) BM. A, Thymic cellularity increases when Egr1-deficient hemopoietic cells are present. B, The ratio between Egr1+/+ (CD90.1) and Egr1−/− (CD90.2) thymocytes remains constant in competitive BM chimeras. Data represent an average of 6–11 mice/group over three independent experiments ± SE.
Egr1 regulates thymic cellularity in a cell nonautonomous manner. Lethally irradiated wild-type hosts were injected with Egr1+/+ (CD90.1) or Egr1−/− (CD90.2) BM or a 1:1 mixture of Egr1+/+ (CD90.1) BM and either Egr1−/− (CD90.2) or Egr1+/+ (CD90.2) BM. A, Thymic cellularity increases when Egr1-deficient hemopoietic cells are present. B, The ratio between Egr1+/+ (CD90.1) and Egr1−/− (CD90.2) thymocytes remains constant in competitive BM chimeras. Data represent an average of 6–11 mice/group over three independent experiments ± SE.
Efficient generation of thymocytes from both Egr1+/+ and Egr1−/− BM
Data from Fig. 5 suggest that the intrinsic abilities of Egr1−/− and Egr1+/+ hemopoietic cells to populate the thymus are similar. To confirm this observation, we used the OP9-DL1 model for thymocyte development. Forced expression of Delta-like 1 on the BM-derived stromal cell line OP9 allows for robust proliferation and T lineage commitment of T lineage precursors from BM progenitors (22). We cultured BM from Egr1+/+ and Egr1−/− mice on OP9-DL1 cells and assayed for DN3 cell numbers by staining Lin− cells for CD44 and CD25 expression. As can be seen in Fig. 6, the presence of Egr1 did not make a significant difference in the yield of DN3 thymocytes that were harvested after 10 days of coculture. The kinetics of thymocyte progenitor production was also similar between Egr1+/+ and Egr1−/− BM (data not shown). These results support the data from Fig. 3 that suggests Egr1−/− mice have normal frequencies and numbers of myelolymphoid progenitors in the BM, and also support the contention that progenitors from Egr1+/+ mice can commit to the T lineage, proliferate, and survive as well as progenitors from Egr1−/− mice. Overall, the results suggest that a cell nonautonomous Egr1-mediated signal from hemopoietic cells regulates the number of ETP.

Lineage commitment and proliferation is normal for Egr1-deficient myelolymphoid progenitors. BM from Egr1+/+ and Egr1−/− mice was plated on OP9-DL1 stromal cells and counted and stained for lineage commitment 10 days later. A, Maturation through the DN stages as monitored by CD44 and CD25 expression on Linlow cells. B, Average recovery of DN3 thymocytes per well. The difference in recovered DN3 cells between Egr1+/+ and Egr1−/− cultures was not statistically significant (p < 0.22). Data represent an average of four mice per group ± SE.
Lineage commitment and proliferation is normal for Egr1-deficient myelolymphoid progenitors. BM from Egr1+/+ and Egr1−/− mice was plated on OP9-DL1 stromal cells and counted and stained for lineage commitment 10 days later. A, Maturation through the DN stages as monitored by CD44 and CD25 expression on Linlow cells. B, Average recovery of DN3 thymocytes per well. The difference in recovered DN3 cells between Egr1+/+ and Egr1−/− cultures was not statistically significant (p < 0.22). Data represent an average of four mice per group ± SE.
Normal localization of CD117+ thymocytes in Egr1-deficient thymuses
The conclusion from the data in Fig. 5 is that Egr1 controls ETP number in a cell nonautonomous manner. However, it remains possible that the loss of Egr1 distorts DN thymocyte development in a way that allows cells to develop independent of normal interactions with stromal cells. We would expect in this scenario that Egr1-deficient DN thymocytes would then be free from stromal niche limitation and possibly be erroneously positioned in the thymus. To investigate this possibility, we performed immunofluorescent analysis of CD117 on Egr1−/− thymic sections. As can be seen in Fig. 7, CD117+ Egr1−/− cells can be found predominantly at the cortical medullary junction and scattered throughout the cortex, much as Egr1+/+ cells are positioned. We also stained for CD25, and found that both CD25+ Egr1−/− cells and CD25+ Egr1+/+ cells were abundantly found at the subcapsular zone (data not shown). Therefore, it appears that Egr1 deficiency does not influence the localization of DN thymocytes. This result suggests that loss of Egr1 does not alter the dependence of thymocytes on proper stromal cell interactions.

Egr1-deficient CD117+ cells are positioned normally in the thymus. Frozen sections of Egr1−/− (right) or Egr1+/+ (left) thymuses were stained for CD117 (green) (original magnification, ×10). Nuclei were counterstained with ToPro-3 (blue) to differentiate between cortex and medulla.
Egr1-deficient CD117+ cells are positioned normally in the thymus. Frozen sections of Egr1−/− (right) or Egr1+/+ (left) thymuses were stained for CD117 (green) (original magnification, ×10). Nuclei were counterstained with ToPro-3 (blue) to differentiate between cortex and medulla.
P-selectin expression is increased in Egr1-deficient mice
A recent report by Rossi et al. (9) demonstrated that an interaction between P-selectin glycoprotein ligand-1 expressed on circulating thymic progenitors and P-selectin on thymic endothelium is required for progenitor entry into the thymus. Furthermore, these authors showed that a feedback loop exists wherein P-selectin expression is regulated by the number of resident ETP (9). It is possible that Egr1 controls a signal that emanates from DN thymocytes to suppress P-selectin expression. As ETP numbers increase, the signal to suppress P-selectin would increase, resulting in feedback regulation to control the overall size of the thymus. In this model, Egr1-deficient mice have increased ETP numbers because an Egr1-mediated signal that suppresses P-selectin expression is lost. To test the model, we investigated P-selectin expression in thymuses from Egr1+/+ and Egr1−/− mice by quantitative real-time RT-PCR. We normalized P-selectin expression to another gene expressed by the endothelium, VE-cadherin, to account for differences in endothelial content and thymic size. As can be seen in Fig. 8,A, thymuses from Egr1−/− mice have increased expression of P-selectin relative to VE-cadherin compared with wild-type littermate controls. Although somewhat variable, the average fold increase of P-selectin in Egr1-deficient thymuses was 2.2 ± 0.6 over littermate controls. Our data suggest that an Egr1-mediated signal feeds back from thymic progenitors to regulate progenitor recruitment to the thymus by P-selectin. To further confirm that loss of Egr1 in thymocytes results in increased levels of P-selectin mRNA in thymic endothelium, we evaluated P-selectin mRNA levels in mixed BM chimeras. Egr1+/+ and Egr1−/− BM were mixed in a 1:1 ratio and injected into lethally irradiated Egr1+/+ hosts and complete thymic reconstitution was allowed. P-selectin expression was then examined by quantitative real-time RT-PCR. As can be seen in Fig. 8 B, injecting a 1:1 mixture of Egr1+/+ and Egr1−/− BM conferred wild-type hosts with intermediate levels of P-selectin mRNA in between hosts that received only Egr1+/+ BM and hosts that received only Egr1−/− BM. These data further support our conclusion that Egr1 regulates P-selectin expression in thymic endothelium through a negative feedback mechanism.

P-selectin expression is increased in Egr1-deficient thymuses. A, P-selectin mRNA in thymuses of paired Egr1-deficient and littermate control mice (n = 9) was quantified by real-time RT-PCR. P-selectin expression was normalized against the endothelial specific molecule VE-cadherin. P-selectin expression is significantly higher in Egr1-deficient thymuses (p < 0.05) than in littermate control thymuses. B, Lethally irradiated wild-type (WT) hosts were injected with Egr1+/+ or Egr1−/− BM or a 1:1 mixture of Egr1+/+ and Egr1−/− BM. P-selectin mRNA in thymuses of hosts that received Egr1+/+ BM (n = 11), Egr1−/− BM (n = 5), or a 1:1 mixture of Egr1+/+ and Egr1−/− BM (n = 13) was quantified by real-time RT-PCR.
P-selectin expression is increased in Egr1-deficient thymuses. A, P-selectin mRNA in thymuses of paired Egr1-deficient and littermate control mice (n = 9) was quantified by real-time RT-PCR. P-selectin expression was normalized against the endothelial specific molecule VE-cadherin. P-selectin expression is significantly higher in Egr1-deficient thymuses (p < 0.05) than in littermate control thymuses. B, Lethally irradiated wild-type (WT) hosts were injected with Egr1+/+ or Egr1−/− BM or a 1:1 mixture of Egr1+/+ and Egr1−/− BM. P-selectin mRNA in thymuses of hosts that received Egr1+/+ BM (n = 11), Egr1−/− BM (n = 5), or a 1:1 mixture of Egr1+/+ and Egr1−/− BM (n = 13) was quantified by real-time RT-PCR.
Exponential increase in ETP number as thymus cellularity increases
Our data suggest that Egr1−/− mice have large thymuses due to significantly increased numbers of ETP. To evaluate the impact of increased ETP number on thymus cellularity, we plotted ETP number vs thymus cellularity for Egr1+/+ and Egr1−/− mice of different ages. The plot shows an exponential increase in ETP number as thymus cellularity increases (Fig. 9,A). The same correlation can be seen for DN2 thymocytes (data not shown). However, when we plotted DN3 cell numbers vs thymus cellularity, we found a linear relationship (Fig. 9 B). These results show that increasing DN3 cell numbers produce a proportional number of DP cells at all thymus sizes. These observations suggest that cells that successfully compete for stromal cell access at the DN3 stage then go on to expand in a cell intrinsic manner. In contrast, as the thymus cellularity (and DN3 cellularity) increases, expanding the number of ETP and DN2 cells has reduced effect on overall cellularity, presumably due to competition among DN3 cells for stromal niches that may become limiting in larger thymuses.

Thymic cellularity grows exponentially as the number of ETP increases. Cell suspensions were prepared from thymuses of Egr1+/+ and Egr1−/− mice and counted. A, ETP number was examined by staining for lineage markers (which included CD25), CD117 and CD44 (R2 = 0.81). B, DN3 cell number was examined by staining Lin− cells for expression of CD44 and CD25 (R2 = 0.84).
Thymic cellularity grows exponentially as the number of ETP increases. Cell suspensions were prepared from thymuses of Egr1+/+ and Egr1−/− mice and counted. A, ETP number was examined by staining for lineage markers (which included CD25), CD117 and CD44 (R2 = 0.81). B, DN3 cell number was examined by staining Lin− cells for expression of CD44 and CD25 (R2 = 0.84).
Discussion
An understanding of the mechanisms that regulate the sizes of organs and organisms is a significant unanswered question in biology. The thymus is a unique organ in that it requires continuous input of progenitor cells from the BM to maintain its steady state size. The thymus contains no self-renewing cells, and even though early progenitors in the thymus are highly proliferative, there must be input of new progenitors to counteract the cell loss resulting from massive apoptosis at the DP stage and thymocyte emigration. The need for replenishment of progenitors from the BM suggests that there could be some sort of feedback from the thymus to the BM to regulate progenitor production and/or entry. An alternative is that progenitor entry could be independent of the size of the thymus and size is regulated by expansion and/or survival of progenitors after they have entered the thymus. Prockop et al. (8) demonstrated that the expansion of DP cells is an intrinsic property of these cells and is not influenced by the size of the thymus. It was also suggested in that study that the number of niches available for DN2 and DN3 cells regulates the expansion of DN thymocytes. It is therefore possible to construct a model whereby the size of the thymus does not depend on feedback from thymocytes to regulate progenitor entry. However, Rossi et al. (9) recently showed that the number of empty progenitor niches in the thymus correlated with P-selectin expression on thymic endothelial cells, and that P-selectin was critical for progenitor entry. This result suggests that resident DN progenitors may also feed back to control entry of new progenitors by regulating P-selectin expression on thymic endothelium.
In this report, we have shown that mice deficient in Egr1 expression have increased thymocyte cellularity when compared with age-matched controls. Our data suggest that the loss of Egr1 does not allow increased survival or proliferation of thymocytes in a cell autonomous manner, but alternatively, an Egr1-mediated signal from hemopoietic cells limits the entry of progenitors. Although we cannot rule out the possibility that the loss of Egr1 allows for increased survival or proliferation of progenitors that have just entered the thymus and that this increase is undetectable by our methods of analysis, our data point to a model in which elimination of Egr1 expression in hemopoietic cells results in increased entry of progenitors into the thymus, which leads to an enlarged thymus. The cell type from which the Egr1-mediated signal emanates to control progenitor entry remains unclear at this point, but it is likely to be one of the early DN thymocyte populations.
It has been shown that P-selectin expression on the thymic endothelium is required for normal entry of thymic progenitors into the thymus from the blood, and that P-selectin expression on thymic endothelium is regulated by the number of available progenitor niches (9). The presence of thymocytes occupying early progenitor niches could conceivably feed back to suppress P-selectin expression so that entry of new progenitors is limited by the presence of abundant progenitors already in the thymus. According to this model, Egr1-deficient thymuses should have decreased levels of P-selectin expression because of the increased numbers of ETP. When we tested for P-selectin expression in Egr1−/− thymi, not only did we find normal levels of P-selectin in some thymi, but most Egr1-deficient thymi had increased levels of P-selectin expression (average of 2.2 ± 0.6-fold increase over littermate controls). We also found increased levels of P-selectin in BM chimeras reconstituted with Egr1−/− BM (Fig. 8 B). These data imply that entry of new progenitors into the thymus from the blood is limited by a signal that is derived from progenitors already in the thymus, and that this signal is promoted by Egr1 expression. Therefore, Egr1-deficient thymuses are recruiting excess numbers thymic progenitors due to the absence of negative feedback that suppresses P-selectin expression. The increased recruitment leads to increased percentages of ETP and DN2 cells, and increased thymus size.
How would an Egr1-mediated signal from hemopoietic cells control P-selectin expression on thymic endothelium? Much of the data concerning the regulation of P-selectin expression is related to inflammatory responses. In these systems, inflammatory mediators such as histamine, thrombin, TNF-α, and LPS can induce P-selectin expression (23). However, the mechanisms underlying the down-regulation of P-selectin are less clear. It appears that NO production by endothelial cells can bind the NO receptor, soluble guanylate cyclase, on endothelial cells and activate cGMP that leads to the down-regulation of P-selectin expression (24). Another report showed that cAMP activation of protein kinase A resulted in the down-regulation of P-selectin expression in platelets (25). Protein kinase A is activated downstream of Gs protein-coupled receptors, so it is possible that Egr1 in DN thymocytes activates the expression or synthesis of a molecule that binds to the G protein-coupled receptors on endothelial cells, thereby activating protein kinase A and shutting off P-selectin expression. Another possibility is that Egr1 is not directly involved in activating the negative feedback signal, but instead is involved in the positioning of DN thymocytes to a site in the thymus where the negative feedback signal can be delivered efficiently. According to this model, the loss of Egr1 impairs the distribution of the negative feedback signal by DN thymocytes because of the erroneous location of Egr1-deficient DN thymocytes. However, examination of the position of CD117+ cells in Egr1-deficient thymi by immunofluorescent analysis shows no apparent defect in the location of progenitors in the absence of Egr1 (Fig. 7).
By plotting ETP number vs the cellularity of the thymus, we have found that at relatively small thymus sizes, changes in ETP number have a fairly significant impact on thymus cellularity, whereas once the thymus has obtained a size 300–400 × 106 cells, increases in ETP number have little impact (Fig. 9,A). This suggests that thymus sizes up to ∼400 × 106 cells can be generated by increases in ETP, but beyond that, some other factor becomes limiting. Prockop et al. (8) showed that thymuses with high numbers of DN3 cells did not allow new progenitors to populate the thymus. Specifically, unirradiated RAG-2−/− thymuses have high numbers of DN3 cells and did not allow thymopoiesis of injected wild-type progenitors. Interestingly, the number of DN3 cells in the largest thymuses that we examined possessed about the same number of DN3 cells as RAG-deficient mice that we analyzed. The implication is that expansion of the DN3 compartment cannot exceed 6–8 million cells, probably due to limits in the number of available niches. This effectively puts a limit on the maximum size of the postnatal murine thymus. When the number of ETP reaches ∼200,000, this produces enough DN3 cells such that competition for space in the DN3 compartment prevents further expansion of thymic cellularity. When we plotted number of DN3 cells vs thymus cellularity, we found that there was a linear relationship (Fig. 9). This fits with the model proposed by Prockop et al. (8) that after the DN3 stage, cells have an intrinsic ability to expand and this ability is insensitive to the overall thymic cellularity. These data suggest that fluctuations in the number of early thymic progenitors can be buffered by intrathymic competition for stromal niche access at the DN3 stage. Our results suggest that there are two critical determinants of thymic cellularity, progenitor entry into the thymus and intrathymic competition for space, especially at the DN3 stage.
In conclusion, we have reported a novel role of Egr1 in the regulation of thymus cellularity. Our results demonstrate that an Egr1-mediated signal from hemopoietic cells regulates the cellularity of the thymus by regulating the number of ETP. Egr1 appears to control ETP number by modulating progenitor entry into the thymus by regulation of P-selectin expression on thymic endothelial cells. Future studies will be needed to determine the molecular link between Egr1 expression in hemopoietic cells and P-selectin expression on the thymic endothelium.
Acknowledgments
We thank Juan Carlos Zúñiga-Pflücker for OP9 and OP9-DL1 cells. Thanks to Jim Zimring for critical review of the manuscript.
Disclosures
The authors have no financial conflict of interest.
Footnotes
The costs of publication of this article were defrayed in part by the payment of page charges. This article must therefore be hereby marked advertisement in accordance with 18 U.S.C. Section 1734 solely to indicate this fact.
This work was supported by a grant from the National Institutes of Health.
Abbreviations used in this paper: BM, bone marrow; Egr1, early growth response gene 1; ETP, early T lineage progenitor; DP, double positive; DN, double negative; VE, vascular endothelial; Lin, lineage.
